. 2006 May 30;103(22):8564-9.
doi: 10.1073/pnas.0508696103. Epub 2006 May 17.

Circadian rhythms in gene transcription imparted by chromosome compaction in the cyanobacterium Synechococcus elongatus

Affiliations

Circadian rhythms in gene transcription imparted by chromosome compaction in the cyanobacterium Synechococcus elongatus

Rachelle M Smith et al. Proc Natl Acad Sci U S A. .

Abstract

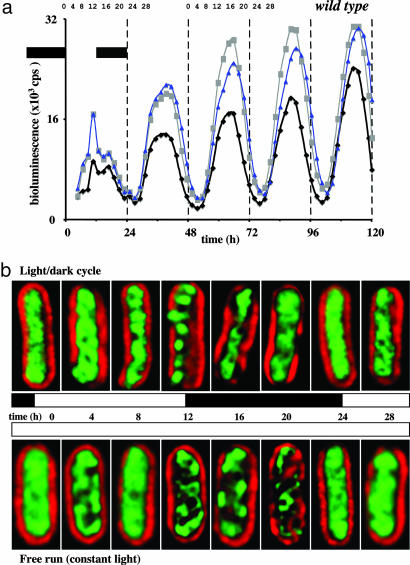
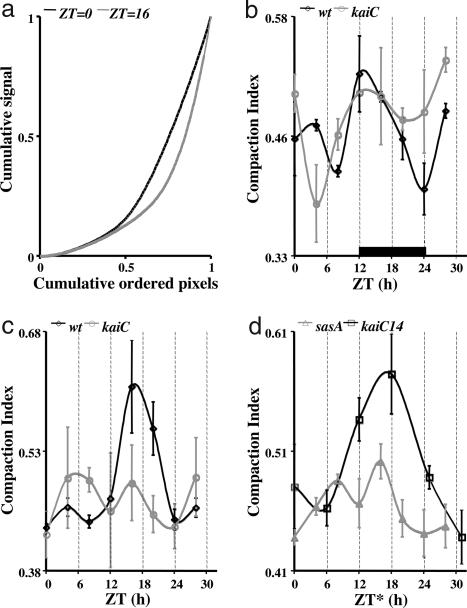
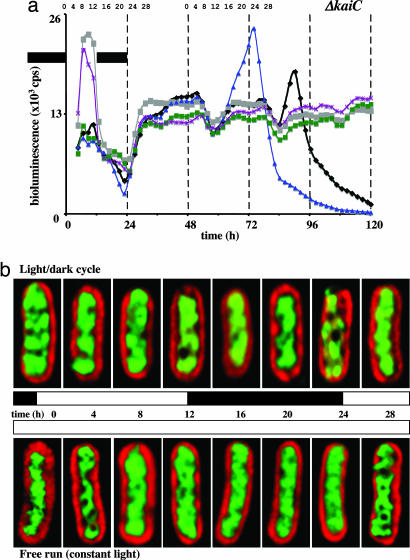
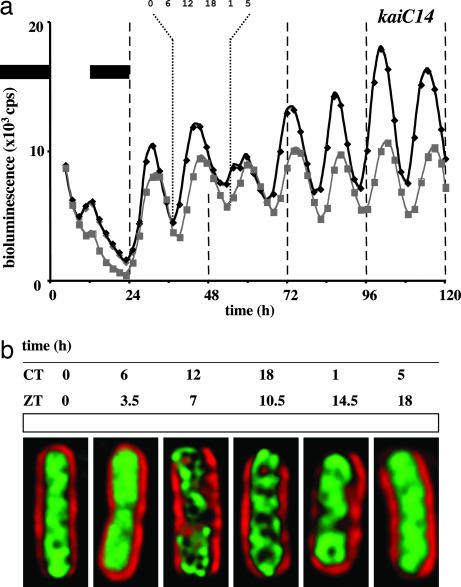
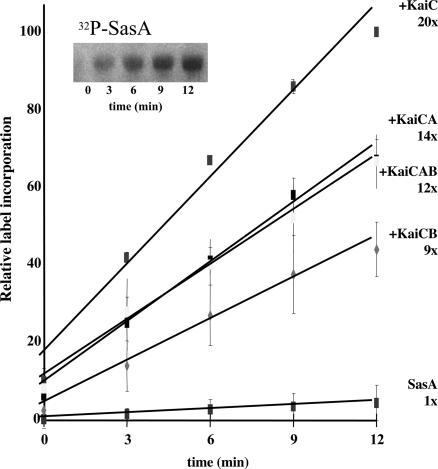
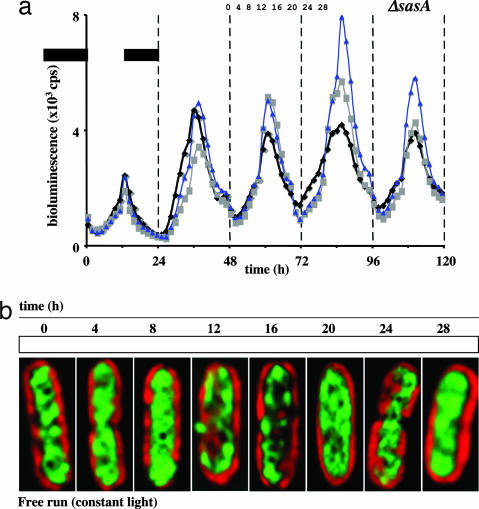
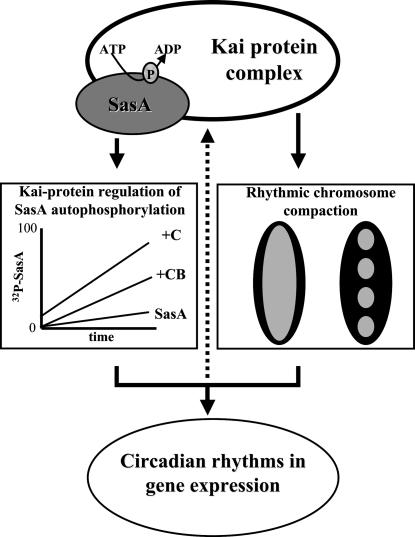
In the cyanobacterium Synechococcus elongatus (PCC 7942) the kai genes A, B, and C and the sasA gene encode the functional protein core of the timing mechanism essential for circadian clock regulation of global gene expression. The Kai proteins comprise the central timing mechanism, and the sensor kinase SasA is a primary transducer of temporal information. We demonstrate that the circadian clock also regulates a chromosome compaction rhythm. This chromosome compaction rhythm is both circadian clock-controlled and kai-dependent. Although sasA is required for global gene expression rhythmicity, it is not required for these chromosome compaction rhythms. We also demonstrate direct control by the Kai proteins on the rate at which the SasA protein autophosphorylates. Thus, to generate and maintain circadian rhythms in gene expression, the Kai proteins keep relative time, communicate temporal information to SasA, and may control access to promoter elements by imparting rhythmic chromosome compaction.


Conflict of interest statement

Conflict of interest statement: No conflicts declared.

Figures

Fig. 1.
Fig. 1.
Gene expression and chromosome compaction rhythms in wild-type S. elongatus. (a) Bioluminescence (counts per second) recorded over time (hours) from a Φ(kaiB-luc+) reporter in an otherwise wild-type S. elongatus strain. Three independent data sets are graphed. The black bars indicate time without illumination. Numbers above the light/dark cycle (time 0–24) and the second free-running (constant condition) cycle (time 48–72) indicate sampling times for the cell images shown in b. (b) Deconvolved fluorescence microscopy images (red, autofluorescence from S. elongatus; green, DAPI-stained DNA) of wild-type cells sampled at the indicated times during the light/dark cycle (Upper) and the second free-running cycle (Lower). The chromosome arrangement image shown for each time point is representative of >99% (n = 300) of the cells from that sample. Each time course experiment was repeated six times with invariant results. For each of the cycles, note the slow arrangement of the DNA into distinct “nucleoids” and then the return to the time 0 diffuse state. Cells are ≈5 μm long.
Fig. 2.
Fig. 2.
Quantification of chromosome compaction. (a) Cumulative DAPI signal from the set of cell-interior pixels, as defined by the rhodamine signal threshold, plotted against cumulative pixels ranked by the strength of the DAPI signal in a wild-type strain. The black line represents a ZT = 0 sample, and the gray line represents a ZT = 16 sample. The area, A, under each curve was used to calculate a CI where CI = 1 − 2A (see Materials and Methods). Higher DAPI signal intensity values located in smaller areas are indicative of a compacted chromosome. Compacted states will impart a higher CI value than diffuse states. All data shown in b–d were analyzed by one-way ANOVA. For each data set (all experimental time points derived from a particular strain), we tested for heterogeneity of CI values among time points. Except for the kaiC strain under constant light (c), CI values were significantly heterogeneous among time points (b: wt, P = 0.00021; kaiC, P = 0.0012; c: wt, P = 0.000001; kaiC, P = 0.064; d: sasA, P = 0.00074; kaiC14, P = 0.00017). (b) CI versus time for a wild-type strain (black) and a kaiC strain (gray) under 12-h light/12-h dark conditions. Three data sets were analyzed for each strain. The black bar indicates time without illumination. (c) As in b, but data were collected under constant illumination. In the kaiC strain, five data sets were analyzed. For the wild-type strain, note that the CI values are low during the subjective day, are high during the subjective night, and return to low CI values at ZT = 24, corresponding to a diffuse chromosome during the subjective day and compacted chromosome during the subjective night. For the kaiC strain, no discernable rhythm in the CI values was observed. Large variations in CI values were apparent between experiments at each time point. (d) As in c, but data are from a kaiC14 strain (black) and an sasA strain (gray). The asterisk indicates that sample times for the kaiC14 strain were converted to circadian time (see kai-Dependent Chromosome Compaction and Fig. 4b). The time point ZT = 30 thus represents CT = 6 for that strain. For each strain, note the gradually increasing CI values that peak around the midpoint of the cycle and then decrease at ZT (or CT) = 24.
Fig. 3.
Fig. 3.
Gene expression and chromosome compaction in an S. elongatus kaiC strain. (a) As in Fig. 1a but with a kaiC-null strain. Five independent data sets are graphed. (b) As in Fig. 1b but with a kaiC-null strain. The chromosome arrangement shown for each time point is representative of >90% (n = 300) of the cells from that sample. Each time course experiment was repeated six times. For any given time point within each experiment, some variation in the extent of chromosome compaction was evident in this mutant strain. This variation was also reflected in the gene expression rhythms illustrated in a. However, we never saw rhythmic compaction patterns (n = 6). Note the partial compaction at several time points in each time course panel. Evidently, KaiC protein is not directly responsible for the entire chromosome compaction process. Cells are 4–5 μm long.
Fig. 4.
Fig. 4.
Gene expression and chromosome compaction rhythms in an S. elongatus kaiC14 strain. (a) As in Fig. 1a but with a kaiC14 strain. Two independent data sets are graphed. (b) As in Fig. 1b but with a kaiC14 strain. Data are from the indicated free-running cycle. The chromosome arrangement shown for each time point is representative of >98% (n = 200) of the cells from that sample. Each time course experiment was repeated four times with invariant results. Note the arrangement of the DNA into distinct nucleoids and then the return to a diffuse state. For ease of comparison to the other image data, sample times were converted to circadian time (CT); the 14-h cycle was divided into 24 equal circadian hours. The ZT sample times are also provided. Cells are 5 μm long.
Fig. 5.
Fig. 5.
Influence of Kai proteins on the autophosphorylation rate of SasA. Assays were run under initial rate conditions as described (see Materials and Methods). The graph illustrates a time course of SasA autophosphorylation with ATP in the presence of (from high rate to low) KaiC; KaiC and KaiA; KaiC, KaiA, and KaiB; KaiC and KaiB; and no additional proteins. Without KaiC present, the other Kai proteins had no effect on SasA autophosphorylation. The SasA protein autophosphorylation rate was also unaffected by the addition of thioredoxin or BSA (data not shown). All time points are the average of four independent experiments, including the one represented by the gel image. Error bars indicate standard deviation from the mean (n = 4). Relative rates determined from the line slopes are indicated.
Fig. 6.
Fig. 6.
Gene expression and chromosome compaction rhythms in an S. elongatus sasA strain. (a) As in Fig. 1a but with an sasA-null strain. Three independent data sets are graphed. (b) As in Fig. 1b but with an sasA-null strain. Data are from the indicated free-running cycle. The chromosome arrangement shown for each time point is representative of >98% (n = 200) of the cells from that sample. Each time course experiment was repeated four times with invariant results regarding rhythmic compaction. Again, note the arrangement of the DNA into more distinct nucleoids and then the return to a diffuse state. Recall that, with the exception of the kai genes, gene expression patterns in the sasA strain are arrhythmic (7). Cells are ≈4 μm long.
Fig. 7.
Fig. 7.
A schematic depiction of circadian clock control of global gene expression in S. elongatus (PCC 7942) is shown. The Kai protein complex keeps relative time (4). Temporal information flows directly from this complex to the SasA protein, regulating its rate of autophosphorylation. As a two-component-type sensor kinase, phosphorylated SasA then controls an undefined signal transduction pathway. Temporal information from the Kai complex also regulates rhythmic chromosome compaction. Together the signal transduction pathway and the chromosome compaction rhythm act to generate circadian rhythms in global gene expression. The dotted arrow represents putative feedback from the expressed gene products upon the Kai complex timing function (1).

References

    1. Ditty J. L., Williams S. B., Golden S. S. Annu. Rev. Genet. 2003;37:513–543. - PubMed
    1. Dunlap J. C., Loros J. J. J. Biol. Rhythms. 2004;19:414–424. - PubMed
    1. Young M. W., Kay S. A. Nat. Rev. Genet. 2001;2:702–715. - PubMed
    1. Nakajima M., Imai K., Ito H., Nishiwaki T., Murayama Y., Iwasaki H., Oyama T., Kondo T. Science. 2005;308:414–415. - PubMed
    1. Tomita J., Nakajima M., Kondo T., Iwasaki H. Science. 2005;307:251–254. - PubMed

Publication types

MeSH terms

Substances

LinkOut - more resources