. 2006 May 17;34(9):e66.
doi: 10.1093/nar/gkl133.

Tests of rRNA hybridization to microarrays suggest that hybridization characteristics of oligonucleotide probes for species discrimination cannot be predicted

Affiliations

Tests of rRNA hybridization to microarrays suggest that hybridization characteristics of oligonucleotide probes for species discrimination cannot be predicted

Alex Pozhitkov et al. Nucleic Acids Res. .

Abstract

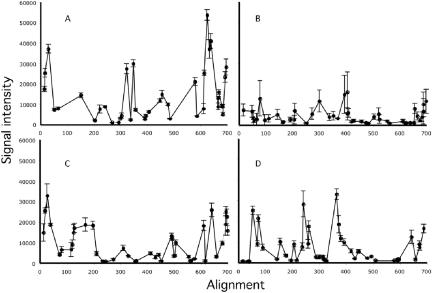
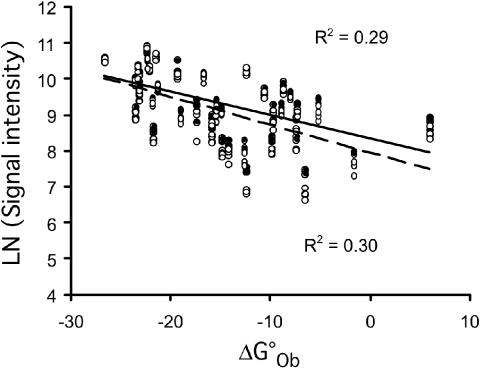
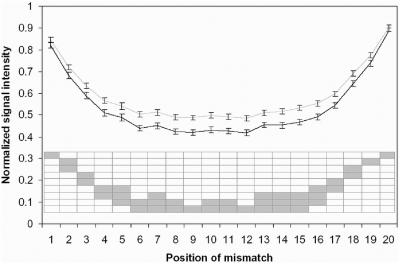
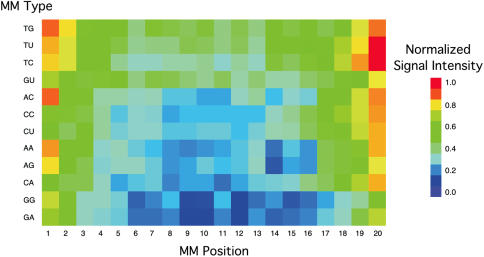
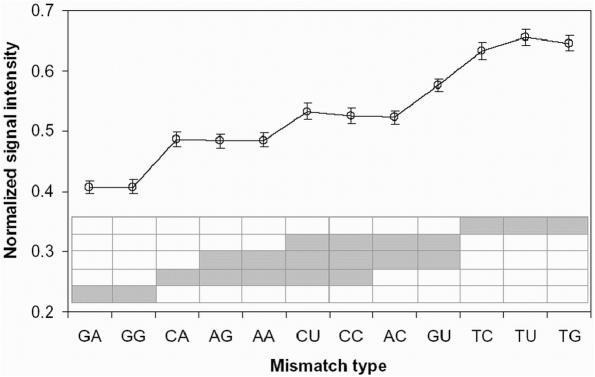
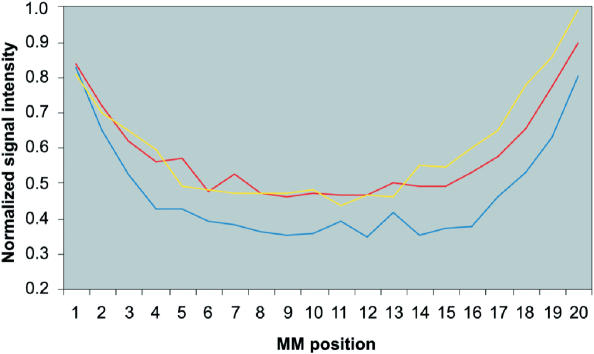
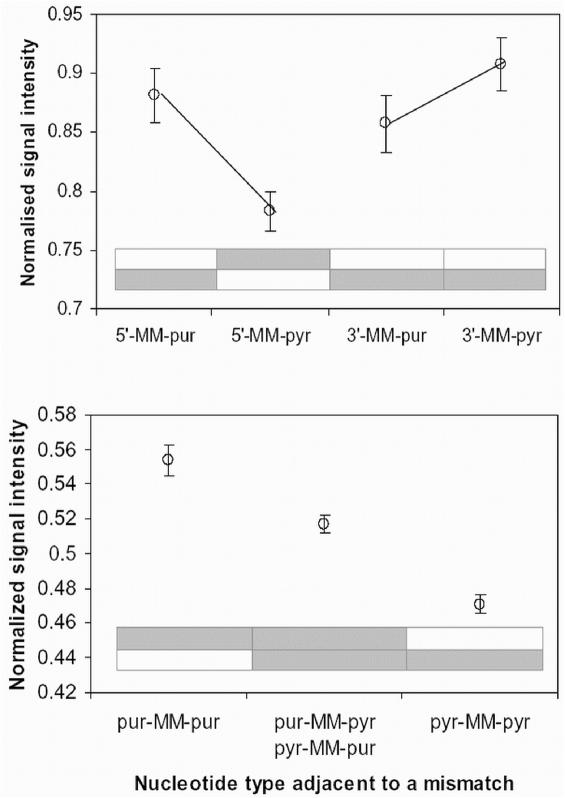
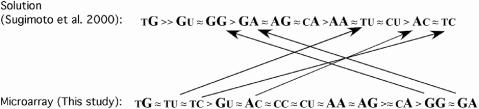
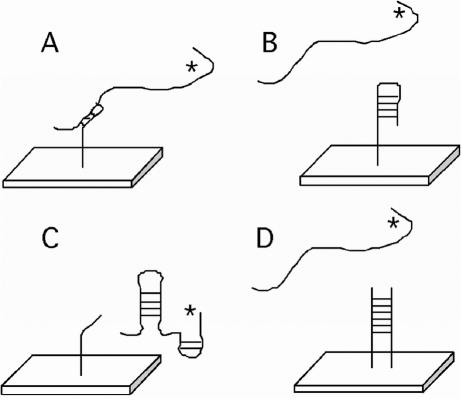
Hybridization of rRNAs to microarrays is a promising approach for prokaryotic and eukaryotic species identification. Typically, the amount of bound target is measured by fluorescent intensity and it is assumed that the signal intensity is directly related to the target concentration. Using thirteen different eukaryotic LSU rRNA target sequences and 7693 short perfect match oligonucleotide probes, we have assessed current approaches for predicting signal intensities by comparing Gibbs free energy (DeltaG degrees) calculations to experimental results. Our evaluation revealed a poor statistical relationship between predicted and actual intensities. Although signal intensities for a given target varied up to 70-fold, none of the predictors were able to fully explain this variation. Also, no combination of different free energy terms, as assessed by principal component and neural network analyses, provided a reliable predictor of hybridization efficiency. We also examined the effects of single-base pair mismatch (MM) (all possible types and positions) on signal intensities of duplexes. We found that the MM effects differ from those that were predicted from solution-based hybridizations. These results recommend against the application of probe design software tools that use thermodynamic parameters to assess probe quality for species identification. Our results imply that the thermodynamic properties of oligonucleotide hybridization are by far not yet understood.


Figures

Figure 1
Figure 1
Signal intensity profiles of PM probes as a function of their position along target rRNAs. Error bars reflect the variance between the four replicates. The x-axis represents the position determined from the alignment based on the secondary structure predictions using the LSU database. (A) sequence 1; (B) sequence 2; (C) sequence 3 and (D) sequence 4.
Figure 2
Figure 2
Relationship between ΔGOb0 and signal intensity for PM probes hybridized to target sequence 1. Free energy calculations were constrained by secondary structure predictions obtained from alignment. Closed circles, non-stringent wash; open circles, stringent wash. Solid trend line, non-stringent wash; dashed trend line, stringent wash.
Figure 3
Figure 3
Average signal intensity values of MM duplexes at positions 1 to 20 normalized to that of the PM duplex (based on around 400 values per position). Error bars represent ±1 standard error of mean. Intensities from low-stringency (gray line) and high-stringency (black line) experiments are shown. Differences between low-stringency and high-stringency experiments are significant for overall dataset and for the individual MM positions at least on the α = 0.05 level by paired t-test. Shaded cells in each row represent a homogenous set of means revealed by GT2 post-hoc analysis at α = 0.05 level.
Figure 4
Figure 4
Heat map of MM type by position as a function of average signal intensity, normalized to the signal intensity of the PM duplex. Each box represents at least 120 replicates.
Figure 5
Figure 5
Average signal intensity values of MM duplexes categorized by MM type. Shaded cells in each row represent a homogenous set of means revealed by GT2 post-hoc analysis at α = 0.05 level. Error bars represent ±1 standard error of mean. Note that each member of mirrored MM pairs (GU and TG, TC and CU, GA and AG, CA and AC) belongs to the different homogenous group. All differences within mirrored pair of mismatches are significant at least at α = 0.01 level in GT2 pair-wise comparisons.
Figure 6
Figure 6
Average signal intensity values of MM duplexes at positions 1 to 20 normalized to signal intensity of the PM duplex by MM type. Pyrimidine:pyrimidine MMs, yellow; Purine:pyrimidine, red; Purine:purine MMs, blue.
Figure 7
Figure 7
Average signal intensity values of MM duplexes categorized by nucleotide type flanking a MM in the probe sequence. Shaded cells in each row represent a homogenous set of means revealed by GT2 post-hoc analysis at α = 0.05 level. Error bars represent ± standard error of mean. Upper panel: Effect of nucleotide types adjacent to a MM at the end of probe. Note that at 5′ end neighboring purine residues stabilize duplex more then pyrimidine residues (P = 0.001), while pattern at the 3′ is opposite and there is no significant difference in GT2 pair-wise comparison. Lower panel: Effect of nucleotide types flanking a MM. Purine residues are stabilizing duplex more than purine–pyrimidine combinations or pyrimidine alone. All differences are significant at α = 0.001 level in GT2 pair-wise comparisons.
Figure 8
Figure 8
The order of stability of RNA/DNA duplexes with a single-base pair MM pairs in solution Sugimoto et al. (39) and on the microarray. For each MM-pair: probe DNA is on the left and target RNA is on the right. The size of the letter distinguishes purines (large) from pyrimidines (small). Lines depict major differences in the order of stability.
Figure 9
Figure 9
Depiction of four competitive processes on signal intensity values. Each panel shows a labeled (*) target and an immobilized probe on a microarray. (A) hybridization of a target to a probe; (B) probe self-folding; (C) folding of the target and (D) dimerization of adjacent probes.

References

    1. DeSantis T.Z., Stone C.E., Murray S.R., Moberg J.P., Andersen G.L. Rapid quantification and taxonomic classification of environmental DNA from both prokaryotic and eukaryotic origins using a microarray. FEMS Microbiol. Lett. 2005;245:271–278. - PubMed
    1. Wilson W.J., Strout C.L., DeSantis T.Z., Stilwell J.L., Carrano A.V., Andersen G.L. Sequence-specific identification of 18 pathogenic microorganisms using microarray technology. Mol. Cell. Probes. 2002;16:119–127. - PubMed
    1. Pozhitkov A., Smidt H., Könneke M., Chernov B., Yershov G., Noble P.A. Evaluation of gel-pad oligonucleotide microarray technology using artificial neural networks. Appl. Environ. Microbiol. 2005;71:8663–8676. - PMC - PubMed
    1. Urakawa H., Noble P.A., El Fantroussi S., Kelly J.J., Stahl D.A. Single-base-pair discrimination of terminal mismatches by using oligonucleotide microarrays and neural network analyses. Appl. Environ. Microbiol. 2002;68:235–244. - PMC - PubMed
    1. Liu W.T., Mirzabekov A.D., Stahl D.A. Optimization of an oligonucleotide microchip for microbial identification studies: a non-equilibrium dissociation approach. Environ. Microbiol. 2001;3:619–629. - PubMed

Publication types