. 2006 May 17;26(20):5456-69.
doi: 10.1523/JNEUROSCI.4101-05.2006.

Phosphatidylinositol 3 kinase activation and AMPA receptor subunit trafficking underlie the potentiation of miniature EPSC amplitudes triggered by the activation of L-type calcium channels

Affiliations

Phosphatidylinositol 3 kinase activation and AMPA receptor subunit trafficking underlie the potentiation of miniature EPSC amplitudes triggered by the activation of L-type calcium channels

Andrew W Baxter et al. J Neurosci. .

Abstract

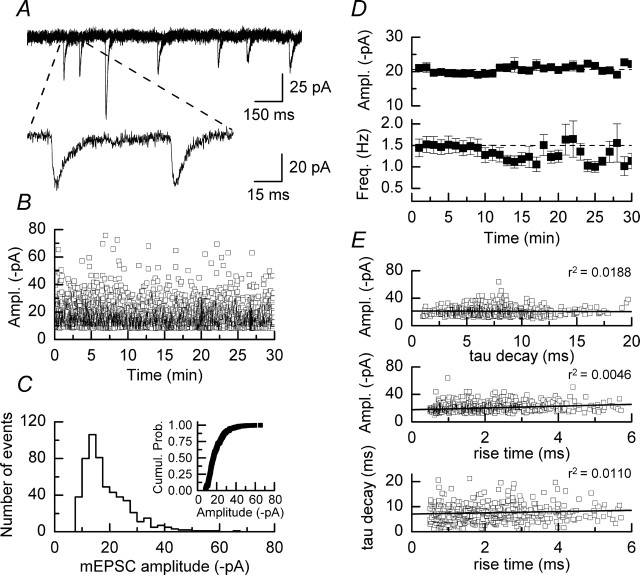
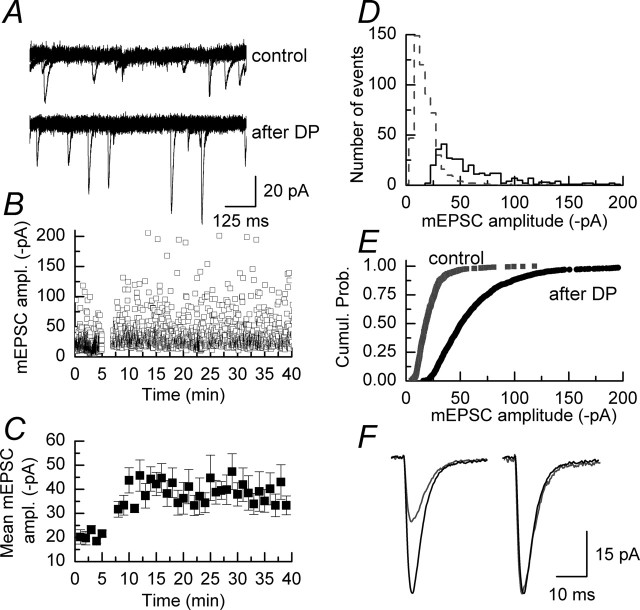
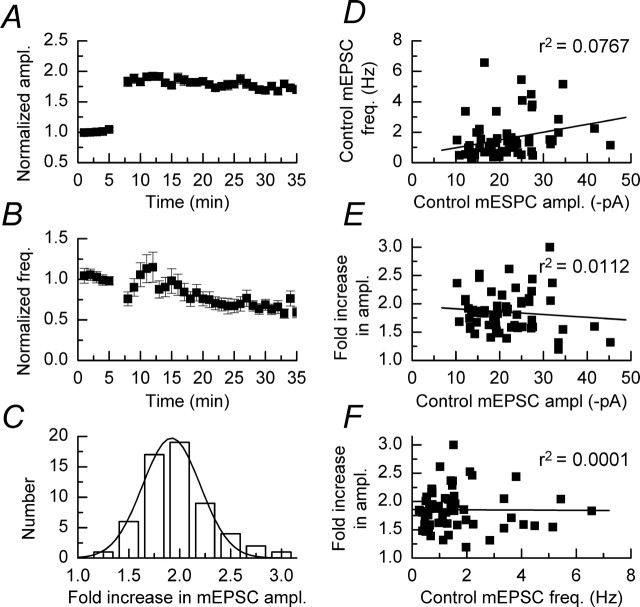
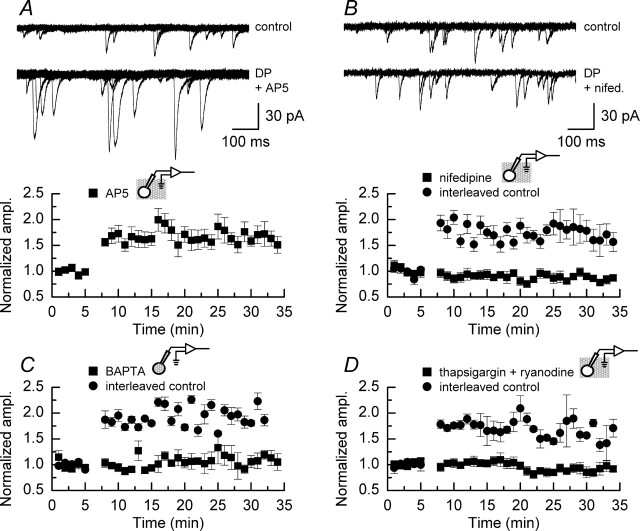
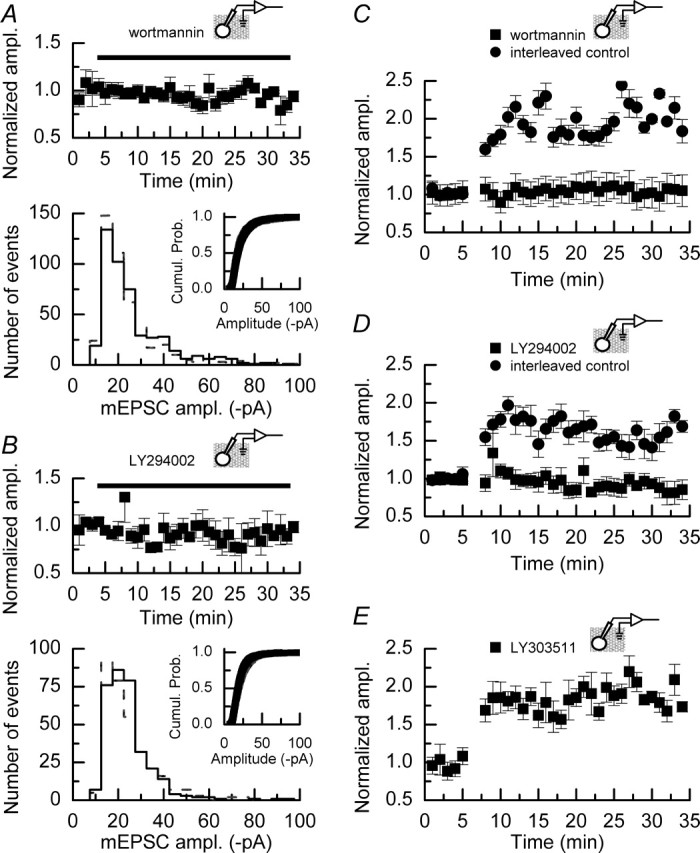
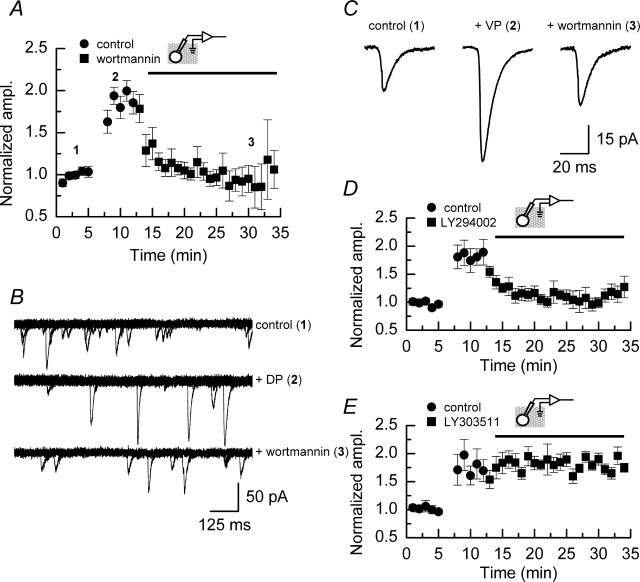
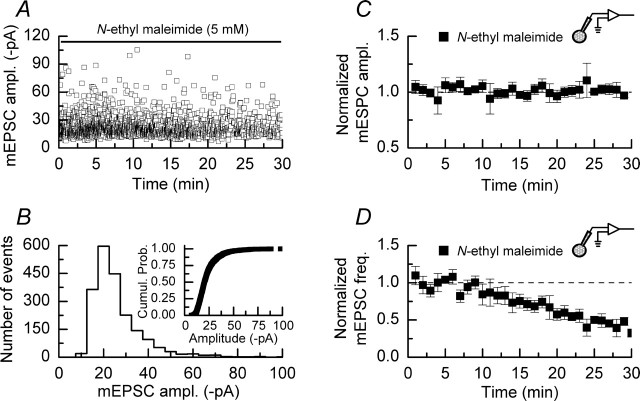
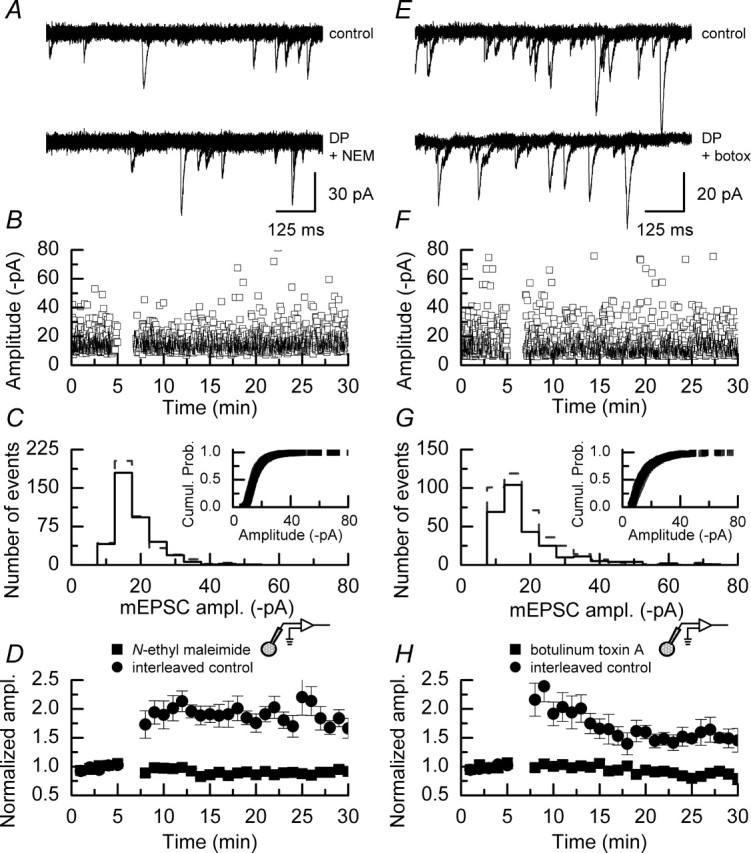
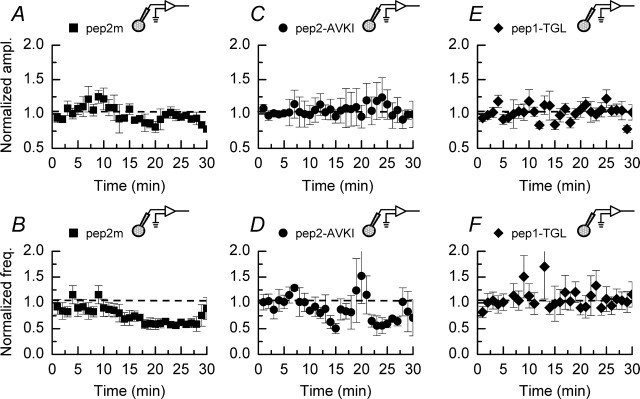
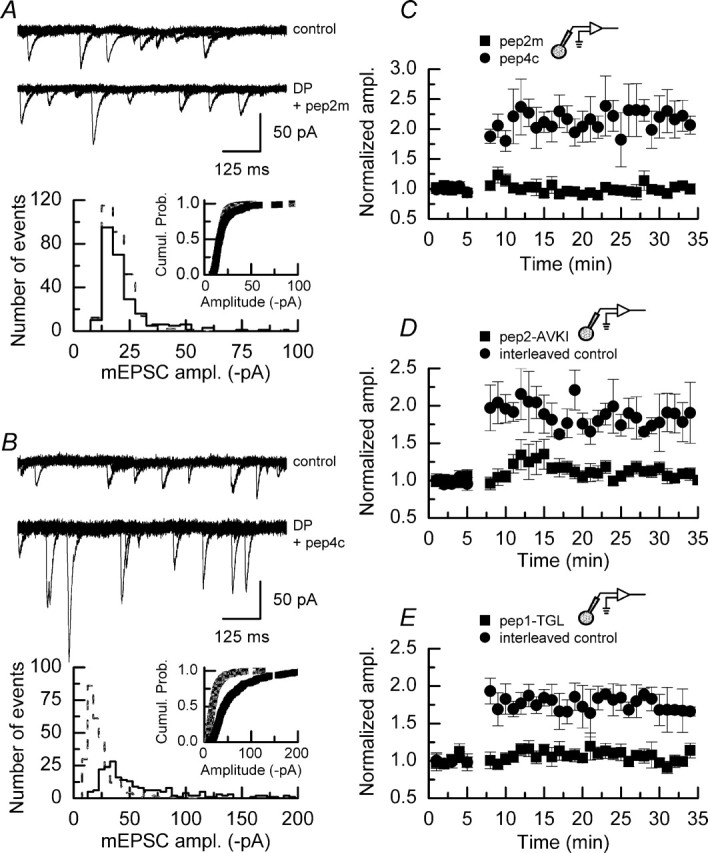
We have characterized a mechanism by which the amplitudes of miniature EPSCs (mEPSCs) in CA1 pyramidal neurons in rat hippocampal organotypic slice cultures are potentiated by approximately twofold after a series of depolarizing voltage pulses from -80 to +20 mV. The increase in mEPSC amplitudes is triggered by the activation of L-type calcium channels and is independent of NMDA receptor (NMDAR) activation but also requires calcium release from intracellular stores. The potentiation induced by depolarizing pulses does not alter the kinetic parameters of mEPSCs. The induction phase of this potentiation involves phosphatidylinositol 3 kinase (PI3 kinase) activation because it is blocked completely in the presence of the PI3 kinase inhibitors wortmannin and 2-(4-morpholinyl)-8-phenyl-4H-1-benzopyran-4-one (LY294002). Furthermore, we show that the maintenance phase of depolarizing pulse potentiation requires continued PI3 kinase activity because the application of either wortmannin or LY294002 results in a reversal to control levels of the amplitudes of mEPSCs. Finally, we demonstrate that the increase in mEPSC amplitudes is mediated by the increased expression of functional AMPA receptors (AMPARs) because the potentiation is blocked by N-ethylmaleimide, botulinum toxin A, and a variety of short-sequence peptides that disrupt the interaction of AMPAR subunits with proteins involved with the trafficking of these to the cell membrane. Our data are consistent with the notion that PI3 kinase and membrane fusion/trafficking events play a pivotal role in coordinating changes in synaptic strength, mediated by AMPA receptors, which are triggered by alterations in postsynaptic calcium concentrations whether these changes are initiated via NMDAR-dependent or NMDAR-independent routes.


Figures

Figure 1.
Figure 1.
Properties of mEPSCs recorded from CA1 pyramidal neurons in hippocampal slice cultures. A, Five superimposed 1500 ms sweeps of recordings of mEPSCs recorded from a CA1 pyramidal neuron at a holding potential of –80 mV. Two mEPSCs are shown at a 10 times faster time base (indicated by dashed lines). B, Plot of the amplitudes of individual mEPSCs recorded over a 30 min period. C, Amplitude histogram of the data obtained in the first 5 min of the recording shown in B. The histogram shows a clear skew in the distribution. The inset shows the same data as those plotted in the histogram but represented as a cumulative probability plot. D, Plots showing the mean amplitude of mEPSCs (top graph) and mean mEPSC frequency (bottom graph) recorded in a series of control experiments (n = 8); error bars indicate the mean ± SEM. There is no apparent rundown in the amplitude of mEPSCs recorded over a 30 min period. E, Plots showing relationships among the rise times, decay time constants, and amplitudes of mEPSCs. In no case is there a significant correlation among these parameters.
Figure 2.
Figure 2.
mEPSC amplitudes are potentiated after a series of depolarizing voltage pulses. A, Five superimposed sweeps of mEPSCs recorded before (top traces) and after (bottom traces) the application of depolarizing pulses to a CA1 pyramidal neuron. B, Plot of the individual amplitudes of mEPSCs recorded in an example experiment. Depolarizing pulses were applied after 5 min. It is apparent that after the depolarizing pulses there is an increase in the number of large-amplitude events (in a given time period) and that there is a shift to larger amplitudes in the size of the smallest events recorded. C, The same data as shown in B but plotted as the mean amplitude of mEPSCs recorded in 1 min bins; error bars indicate the mean ± SEM. D, Amplitude histogram of data illustrated in B recorded in the control period (gray dashed line/gray symbols) and in a similar time period at approximately the peak of the potentiation (solid line/black symbols). There is a clear rightward shift in the plots after the potentiation of mEPSCs. E, Cumulative probability plot of the data shown in D. F, Examples of mean mEPSC waveforms obtained by averaging 50 events recorded before the application of depolarizing pulses (gray trace) and 50 events recorded at approximately the peak of the potentiation (black trace). Scaling the control mEPSC time course to the same amplitude of the potentiated mEPSC results in a superimposition of the two traces and indicates that there is no change in the kinetic parameters of mEPSCs associated with their increased amplitude.
Figure 3.
Figure 3.
Mean data from all control experiments performed during the course of this study (n = 60). A, Mean time course of DPP showing that there is an approximately twofold increase in the amplitude of mEPSCs triggered by the application of depolarizing pulses, which does not show a significant decline over the time course of the experiment. B, Plot showing the mean (normalized) mEPSC frequency; error bars indicate the mean ± SEM. After the application of depolarizing pulses there is a small transient potentiation of frequencies. C, Histogram showing the range in the fold increase of mEPSC amplitudes after the application of depolarizing pulses. These values appear to be distributed normally around a mean of a twofold increase. D, No significant correlation between the mean mEPSC amplitude and the mean frequency is observed. E, F, Plots showing the lack of correlation between either the control mean mEPSC amplitude or control mean mEPSC frequency and the extent of the potentiation seen after the application of depolarizing pulses.
Figure 4.
Figure 4.
DPP is NMDAR independent but requires the activation of L-type calcium channels and calcium release from internal stores. A, Superimposed sweeps of mEPSC activity recorded before (top traces) and after (bottom traces) the application of depolarizing pulses in the presence of d-AP5 (50 μm). There is a clear increase in the amplitude of mEPSCs in the sweeps shown in the bottom traces. The time course of the potentiation seen in the presence of d-AP5 (n = 5) is not different from that seen in the absence of this antagonist (the plot below the mEPSC traces). B, Superimposed sweeps of mEPSC activity recorded before (top traces) and after (bottom traces) the application of depolarizing pulses in the presence of nifedipine (10 μm). As illustrated in the plot below the mEPSC traces, blocking L-type calcium channels prevents the increase in mEPSC amplitudes, whereas interleaved control experiments give typical potentiation. C, Preventing the rise in intracellular calcium by including BAPTA (10 mm) in the recording solution used to fill the patch pipette also prevents potentiation. D, Interfering with intracellular calcium stores by treating slices with a combination of thapsigargin and ryanodine (each 10 μm) also blocks potentiation. In this and subsequent figures we indicate whether the pharmacological manipulations used to interfere with DPP were applied in the external recording solution (as depicted in A, B, D above the plots) or were included in the internal recording solution (as depicted in C). For experiments illustrated in A, B, and D, drugs were present throughout the duration of these recordings. Interleaved control experiments were performed to ensure that reliable DPP could be achieved when experiments examining the pharmacological characterization of depolarizing pulse potentiation were being undertaken. These are depicted (by filled circles) in B (n = 2), C (n = 3), and D (n = 4). Error bars indicate the mean ± SEM.
Figure 5.
Figure 5.
Inhibitors of PI3 kinase do not affect the amplitudes of mEPSCs recorded under control conditions but do block the induction of DPP. A, Top, Mean data from experiments (n = 4) in which wortmannin (100 nm) was applied to slices, but no depolarizing pulses were delivered to CA1 neurons. At this concentration, this PI3 kinase inhibitor does not alter the mean mEPSC amplitude recorded over the time course of the experiment. A, Bottom, Amplitude histogram and cumulative probability plot (inset) from one of the experiments contributing to the data illustrated at the top recorded either before the application of wortmannin (gray dashed line/gray symbols) or after the application of this inhibitor (solid line/black symbols). The distribution of mEPSC amplitudes is not affected by treatment with wortmannin. B, Top, Mean data from experiments (n = 3) in which LY294002 (5 μm) was applied to slices, but no depolarizing pulses were delivered to CA1 neurons. As is the case with wortmannin, this concentration of LY294002 does not alter the mean mEPSC amplitude recorded over the time course of the experiment. B, Bottom, Amplitude histogram and cumulative probability plot (inset) from one of the experiments contributing to the data illustrated at the top recorded either before (gray dashed line/gray symbols) or after (solid line/black symbols) the application of LY294002, showing that there is no change in the distribution of events in the absence or presence of this inhibitor. C, Bath application of wortmannin (100 nm; n = 6) blocks the induction of DPP, whereas interleaved control experiments (n = 6) show typical potentiation of mEPSC amplitudes. D, Bath application of LY294002 (5 μm; n = 6) blocks the induction of DPP, whereas interleaved control experiments (n = 5) show typical potentiation of mEPSC amplitudes. E, The inactive analog LY303511 (5 μm; n = 5) does not prevent the induction of DPP. For experiments illustrated in CE, drugs were present throughout the duration of these recordings. Error bars indicate the mean ± SEM.
Figure 6.
Figure 6.
Inhibitors of PI3 kinase can reverse the increase in mEPSC amplitudes induced by DPP. A, Bath application of wortmannin (100 nm; n = 8) after the induction of DPP reverses the increase in mEPSC amplitude. Within 10 min of the application of this PI3 kinase inhibitor, the mean amplitudes of mEPSCs return to baseline levels. B, Superimposed sweeps on mEPSC activity recorded during the control period (1), at approximately the peak of the potentiation (2), and after wortmannin has reversed the increase caused by the application of depolarizing pulses (3). C, Examples of mean time courses of mEPSCs recorded during the periods indicated in A and B. The 10–90% rise times for the mean mEPSC from all three time periods are similar (control, 1.5 ± 0.1 ms; potentiated, 1.6 ± 0.1 ms; wortmannin-treated, 1.2 ± 0.2 ms). Similarly, the decay time constants show little difference among the three groups (control, 10.0 ± 0.7 ms; potentiated, 11.2 ± 0.3 ms; wortmannin-treated, 10.0 ± 1.1 ms). D, The PI3 kinase inhibitor LY294002 (5 μm; n = 7) also reverses the increase in mEPSC amplitudes induced by depolarizing pulses, with a time course similar to that seen with wortmannin. E, The inactive analog LY303511 (5 μm; n = 4) does not result in a reversal of DPP. Error bars indicate the mean ± SEM.
Figure 7.
Figure 7.
NEM does not affect the amplitude of mEPSCs but reduces their frequency. A, Data from a single experiment showing the amplitude of individual mEPSCs recorded with a patch pipette filled with an internal solution containing NEM (5 mm). B, Amplitude histogram and cumulative probability plot (inset) of the data shown in A. C, Pooled data (n = 3) showing that the amplitudes of mEPSCs are stable in the presence of NEM over a 30 min recording period. D, NEM causes the frequencies of mEPSCs to decrease during the course of a 30 min recording. The dashed line indicates the normalized mEPSC frequency observed during the initial 5 min of recording. Error bars indicate the mean ± SEM.
Figure 8.
Figure 8.
NEM or botulinum toxin A applied to the postsynaptic cell blocks the induction of DPP. A, Superimposed sweeps of mEPSC activity recorded before (top traces) and after (bottom traces) the application of depolarizing pulses in the presence of NEM (5 mm). B, Plot of the individual amplitudes of mEPSCs recorded in an example experiment. Depolarizing pulses were applied after 5 min; it is apparent that after the depolarizing pulses there was no clear increase in the amplitudes of the largest events recorded nor a shift in the amplitude of the smallest events seen in experiments in which NEM was absent (Fig. 2B, for example). C, Amplitude histogram and cumulative probability plot (inset) of the data illustrated in B recorded in the control period (gray dashed line/gray symbols) and in a similar time period after the application of depolarizing pulses (solid line/black symbols). Both the histogram and cumulative probability plot of mEPSC amplitudes are similar and indicate that the presence of NEM in the internal recording solution blocked the potentiation. D, Mean data from all experiments in which NEM was included in the internal recording solution (n = 6) and data from interleaved control experiments (n = 6). DPP was blocked in all of the cells that were examined when NEM was present, whereas typical potentiation was seen in the interleaved control experiments; error bars indicate the mean ± SEM. E, Superimposed sweeps of mEPSC activity recorded before (top traces) and after (bottom traces) the application of depolarizing pulses in the presence of botulinum toxin A (10 ng/ml). F, Plot of the individual amplitudes of mEPSCs recorded in an example experiment. Depolarizing pulses were applied after 5 min, and, similar to the data obtained with NEM, botulinum toxin A prevented the increase in the amplitudes of the largest events recorded and a shift in the amplitude of the smallest events. G, Amplitude histogram and cumulative probability plot (inset) of the data illustrated in F recorded in the control period (gray dashed line/gray symbols) and in a similar time period after the application of depolarizing pulses (solid line/black symbols). No significant differences were seen in these distributions. H, Mean data from all experiments in which botulinum toxin A was included in the internal recording solution (n = 7) and data from interleaved control experiments (n = 5); error bars indicate the mean ± SEM. DPP was blocked in all of the cells that were examined when botulinum toxin A was present, whereas potentiation was seen in the interleaved control experiments.
Figure 9.
Figure 9.
Effects of peptide inhibitors on control mEPSC amplitudes and frequencies. A, B, Effect of pep2m (50 μm; n = 4) on mEPSCs recorded in the absence of depolarizing pulses. Although pep2m does not affect the amplitude of events, their frequencies are reduced significantly in the final 10 min of the recording period as compared with the initial 10 min of recording (p < 0.05; Mann–Whitney U). C, D, Pep2-AVKI (50 μm; n = 3) does not affect the amplitude of mEPSCs. The frequencies of mEPSCs are not significantly different during the initial and final 10 min of recording (p > 0.05, Mann–Whitney U). E, F, Pep1-TGL (50 μm; n = 3) on its own does not affect the amplitudes or frequencies of mEPSCs. The dashed lines indicate the normalized mEPSC amplitudes or frequencies observed during the initial 5 min of recording. Error bars indicate the mean ± SEM.
Figure 10.
Figure 10.
Pep2m, pep2-AVKI, and pep1-TGL each block the induction of DPP. A, Top, Superimposed sweeps of mEPSC activity recorded before (top traces) and after (bottom traces) the application of depolarizing pulses in the presence of pep2m (50 μm). A, Bottom, Amplitude histogram and cumulative probability plot (inset) of mEPSC amplitudes recorded in a control period (gray dashed line/gray symbols) and in a similar time period after the application of depolarizing pulses (solid line/black symbols). No significant differences are seen in these distributions. B, Top, Shown are superimposed sweeps of mEPSC activity recorded before (top traces) and after (bottom traces) the application of depolarizing pulses in the presence of pep4c (50 μm), a peptide that differs from pep2m by a single amino acid; the asparagine residue at position 8 of pep2m is replaced by a serine residue in pep4c. In the presence of pep4c, clear potentiation of mEPSC amplitudes can be seen. B, Bottom, Amplitude histogram and cumulative probability plot (inset) of mEPSC amplitudes recorded in a control period (gray dashed line/gray symbols) and in a similar time period after the application of depolarizing pulses (solid line/black symbols). Shifts in mEPSC amplitudes are clearly apparent in both distributions, indicating that pep4c does not prevent the induction of the potentiation. C, Mean data from all experiments in which either pep2m (▪; n = 8) or pep4c (•;; n = 4) was included in the internal recording solution; error bars indicate the mean ± SEM. Only in the presence of pep2m is DPP blocked. D, Mean data from all experiments in which pep2-AVKI (▪; n = 8) was included in the internal recording solution and corresponding control experiments performed during the same period (•;; n = 3); error bars indicate the mean ± SEM. A small but transient potentiation of mEPSC amplitudes was seen in the presence of pep2-AVKI. E, Mean data from all experiments in which pep1-TGL (▪; n = 7) was included in the internal recording solution; error bars indicate the mean ± SEM. Complete block of potentiation was observed when this peptide was present. Data from interleaved control experiments (•;; n = 5) showed typical potentiation.

References

    1. Adesnik H, Nicoll RA, England PM (2005). Photoinactivation of native AMPA receptors reveals their real-time trafficking. Neuron 48:977–985. - PubMed
    1. Banke TG, Bowie D, Lee H, Huganir RL, Schousboe A, Traynelis SF (2000). Control of GluR1 AMPA receptor function by cAMP-dependent protein kinase. J Neurosci 20:89–102. - PMC - PubMed
    1. Benke TA, Luthi A, Isaac JT, Collingridge GL (1998). Modulation of AMPA receptor unitary conductance by synaptic activity. Nature 393:793–797. - PubMed
    1. Blackstone C, Sheng M (1999). Protein targeting and calcium signaling microdomains in neuronal cells. Cell Calcium 26:181–192. - PubMed
    1. Bredt DS, Nicoll RA (2003). AMPA receptor trafficking at excitatory synapses. Neuron 40:361–379. - PubMed

Publication types

MeSH terms

LinkOut - more resources