

Electrical excitation of the acoustically sensitive auditory nerve: single-fiber responses to electric pulse trains
- PMID: 16708257
- PMCID: PMC2504607
- DOI: 10.1007/s10162-006-0036-9
Electrical excitation of the acoustically sensitive auditory nerve: single-fiber responses to electric pulse trains
Abstract
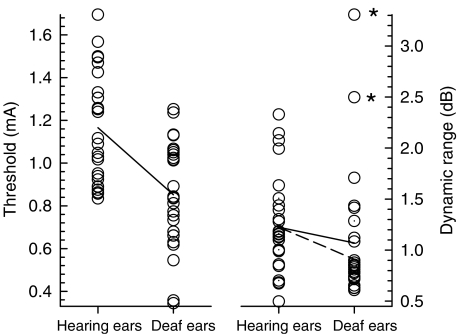
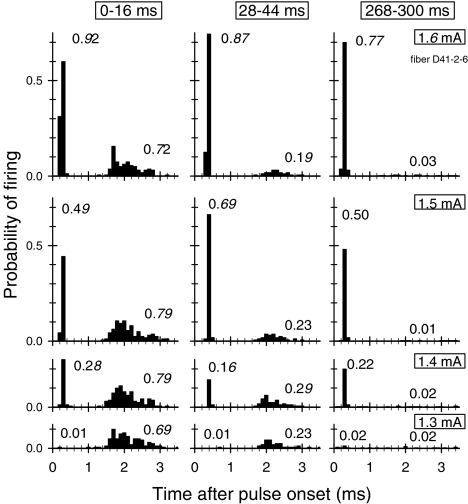
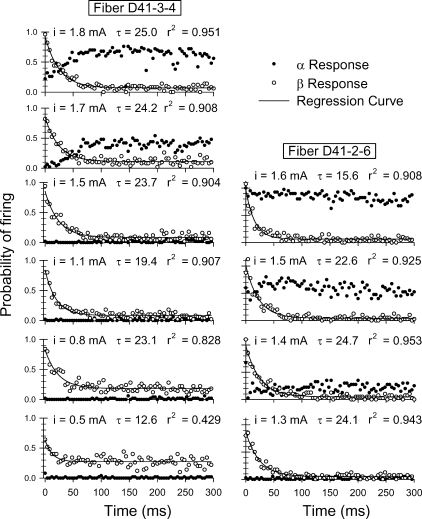
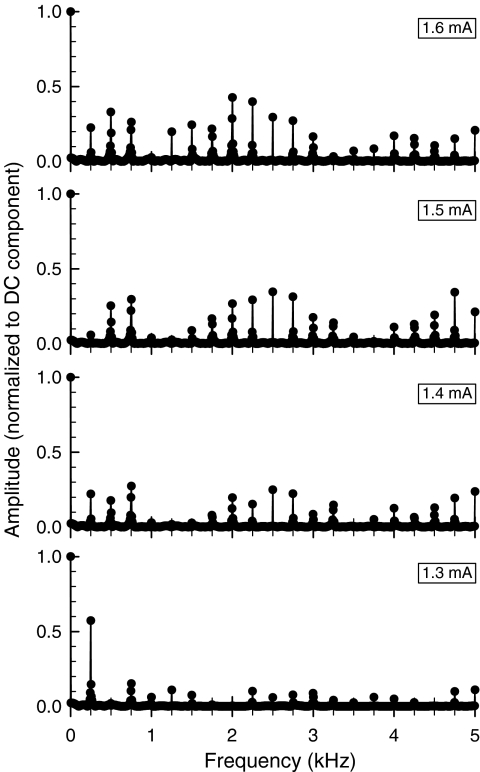
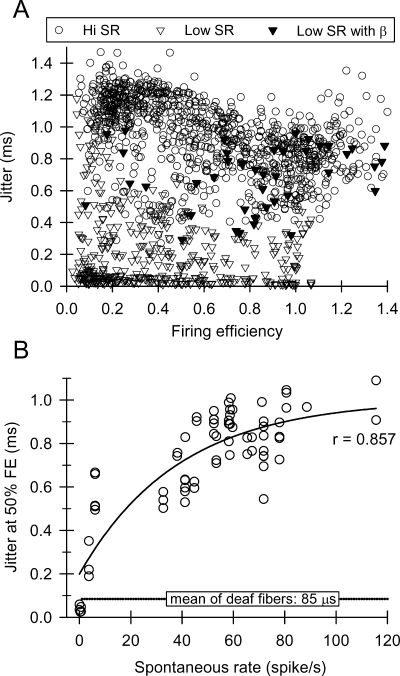
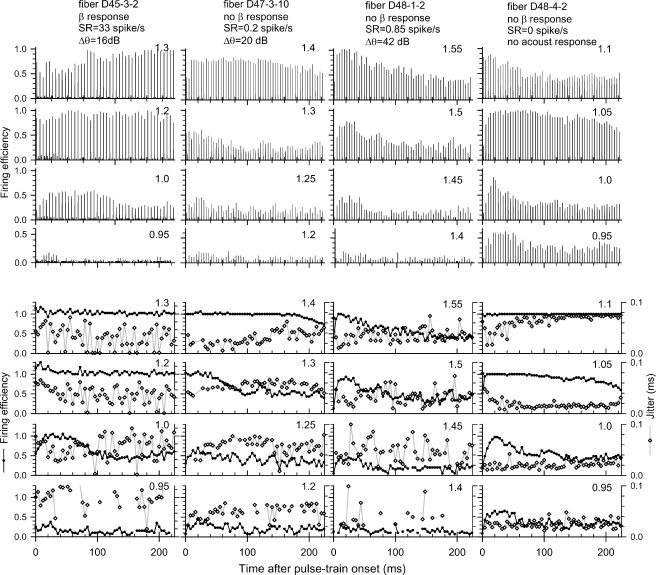
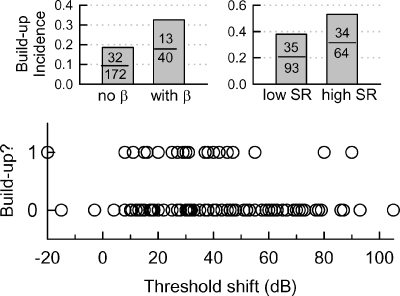
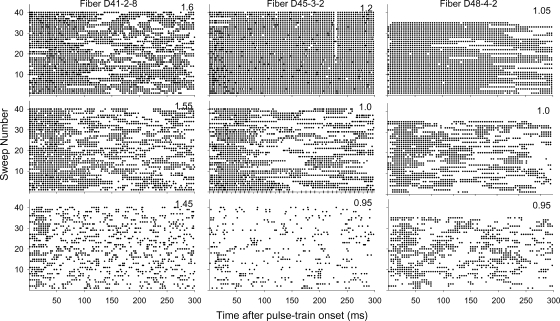
Nearly all studies on auditory-nerve responses to electric stimuli have been conducted using chemically deafened animals so as to more realistically model the implanted human ear that has typically been profoundly deaf. However, clinical criteria for implantation have recently been relaxed. Ears with "residual" acoustic sensitivity are now being implanted, calling for the systematic evaluation of auditory-nerve responses to electric stimuli as well as combined electric and acoustic stimuli in acoustically sensitive ears. This article presents a systematic investigation of single-fiber responses to electric stimuli in acoustically sensitive ears. Responses to 250 pulse/s electric pulse trains were collected from 18 cats. Properties such as threshold, dynamic range, and jitter were found to differ from those of deaf ears. Other types of fiber activity observed in acoustically sensitive ears (i.e., spontaneous activity and electrophonic responses) were found to alter the temporal coding of electric stimuli. The electrophonic response, which was shown to greatly change the information encoded by spike intervals, also exhibited fast adaptation relative to that observed in the "direct" response to electric stimuli. More complex responses, such as "buildup" (increased responsiveness to successive pulses) and "bursting" (alternating periods of responsiveness and unresponsiveness) were observed. Our findings suggest that bursting is a response unique to sustained electric stimulation in ears with functional hair cells.
Figures
Similar articles
-
Desynchronization of electrically evoked auditory-nerve activity by high-frequency pulse trains of long duration.J Acoust Soc Am. 2003 Oct;114(4 Pt 1):2066-78. doi: 10.1121/1.1612492. J Acoust Soc Am. 2003. PMID: 14587606 Free PMC article.
-
Electrical stimulation of the auditory nerve. III. Response initiation sites and temporal fine structure.Hear Res. 2000 Feb;140(1-2):45-76. doi: 10.1016/s0378-5955(99)00186-0. Hear Res. 2000. PMID: 10675635
-
Improved temporal coding of sinusoids in electric stimulation of the auditory nerve using desynchronizing pulse trains.J Acoust Soc Am. 2003 Oct;114(4 Pt 1):2079-98. doi: 10.1121/1.1612493. J Acoust Soc Am. 2003. PMID: 14587607 Free PMC article.
-
Physiological Mechanisms in Combined Electric-Acoustic Stimulation.Otol Neurotol. 2017 Sep;38(8):e215-e223. doi: 10.1097/MAO.0000000000001428. Otol Neurotol. 2017. PMID: 28806329 Review.
-
Functional development of hair cells.Curr Top Dev Biol. 2003;57:389-448. doi: 10.1016/s0070-2153(03)57013-2. Curr Top Dev Biol. 2003. PMID: 14674488 Review. No abstract available.
Cited by
-
Towards the optical cochlear implant: optogenetic approaches for hearing restoration.EMBO Mol Med. 2020 Apr 7;12(4):e11618. doi: 10.15252/emmm.201911618. Epub 2020 Mar 30. EMBO Mol Med. 2020. PMID: 32227585 Free PMC article. Review.
-
Hearing Loss After Activation of Hearing Preservation Cochlear Implants Might Be Related to Afferent Cochlear Innervation Injury.Otol Neurotol. 2015 Jul;36(6):1035-44. doi: 10.1097/MAO.0000000000000754. Otol Neurotol. 2015. PMID: 25955750 Free PMC article.
-
Towards translational optogenetics.Nat Biomed Eng. 2023 Apr;7(4):349-369. doi: 10.1038/s41551-021-00829-3. Epub 2022 Jan 13. Nat Biomed Eng. 2023. PMID: 35027688 Review.
-
Is there an unmet medical need for improved hearing restoration?EMBO Mol Med. 2022 Aug 8;14(8):e15798. doi: 10.15252/emmm.202215798. Epub 2022 Jul 14. EMBO Mol Med. 2022. PMID: 35833443 Free PMC article. Review.
-
A novel stimulus artifact removal technique for high-rate electrical stimulation.J Neurosci Methods. 2008 May 30;170(2):277-84. doi: 10.1016/j.jneumeth.2008.01.023. Epub 2008 Feb 3. J Neurosci Methods. 2008. PMID: 18339428 Free PMC article.
References
-
- None
- Abbas PJ, Etler CP, Nourski K, Brown CJ, Miller CA. Responses to electrical stimulation in individuals with residual hair cell function. Abstract. Objective Measures in Cochlear Implants. Germany, Hannover, 2005.
-
- None
- Bevington PR. Data reduction and error analysis for the physical sciences. New York, McGraw-Hill, 1969.
-
- {'text': '', 'ref_index': 1, 'ids': [{'type': 'DOI', 'value': '10.1126/science.3966153', 'is_inner': False, 'url': 'https://doi.org/10.1126/science.3966153'}, {'type': 'PubMed', 'value': '3966153', 'is_inner': True, 'url': 'https://pubmed.ncbi.nlm.nih.gov/3966153/'}]}
- Brownell WE, Bader CR, Bertrand D, de Ribaupierre Y. Evoked mechanical responses of isolated cochlear outer hair cells. Science 227:194–196, 1985. - PubMed
-
- {'text': '', 'ref_index': 1, 'ids': [{'type': 'DOI', 'value': '10.1016/S0378-5955(00)00109-X', 'is_inner': False, 'url': 'https://doi.org/10.1016/s0378-5955(00)00109-x'}, {'type': 'PubMed', 'value': '10913891', 'is_inner': True, 'url': 'https://pubmed.ncbi.nlm.nih.gov/10913891/'}]}
- Cartee LA, van den Honert C, Finley CC, Miller RL. Evaluation of a model of the cochlear neural membrane. I. Physiological measurement of membrane characteristics in response to intrametal electrical stimulation. Hear. Res. 146:143–152, 2000. - PubMed
-
- Dynes SBC. Discharge characteristics of auditory nerve fibers for pulsatile electrical stimuli. Ph.D. thesis, Massachusetts Institute of Technology (Dept. of Physics), 1996.
Publication types
MeSH terms
Grants and funding
LinkOut - more resources
Full Text Sources
Miscellaneous
