

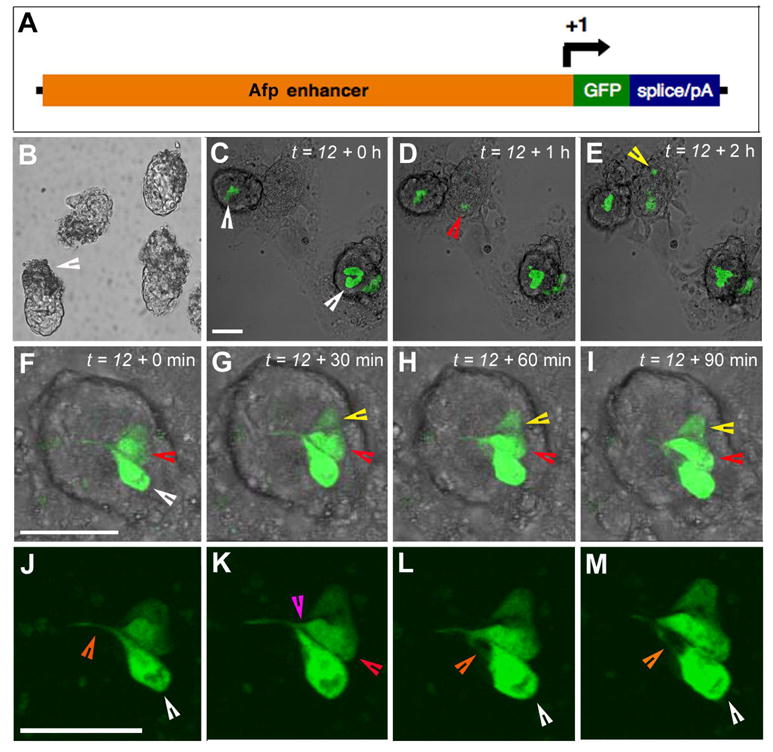
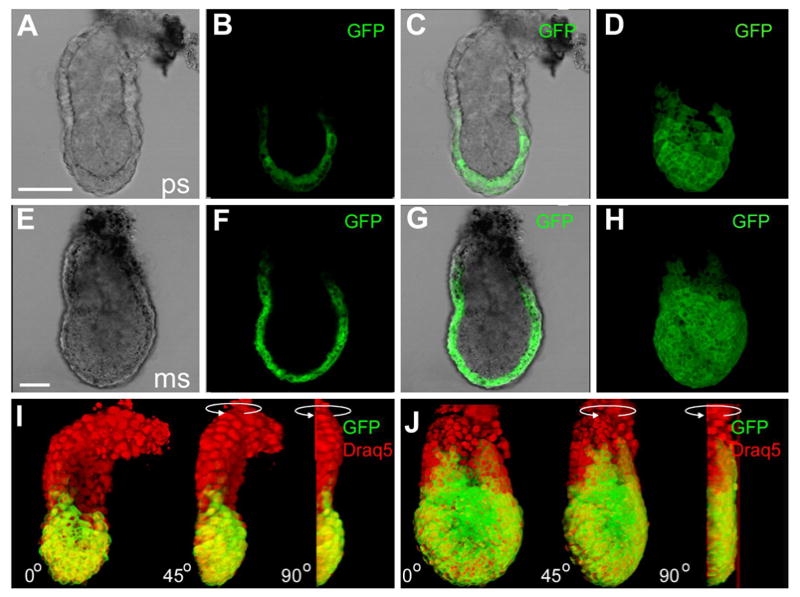
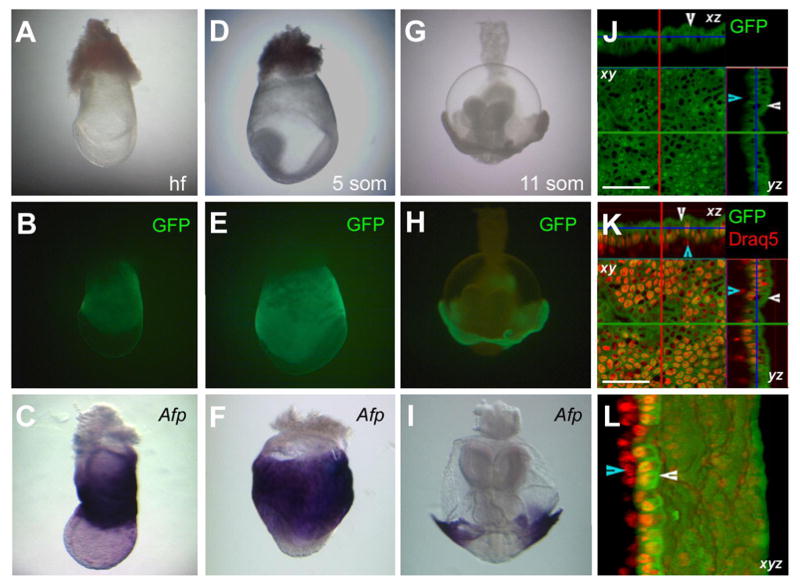
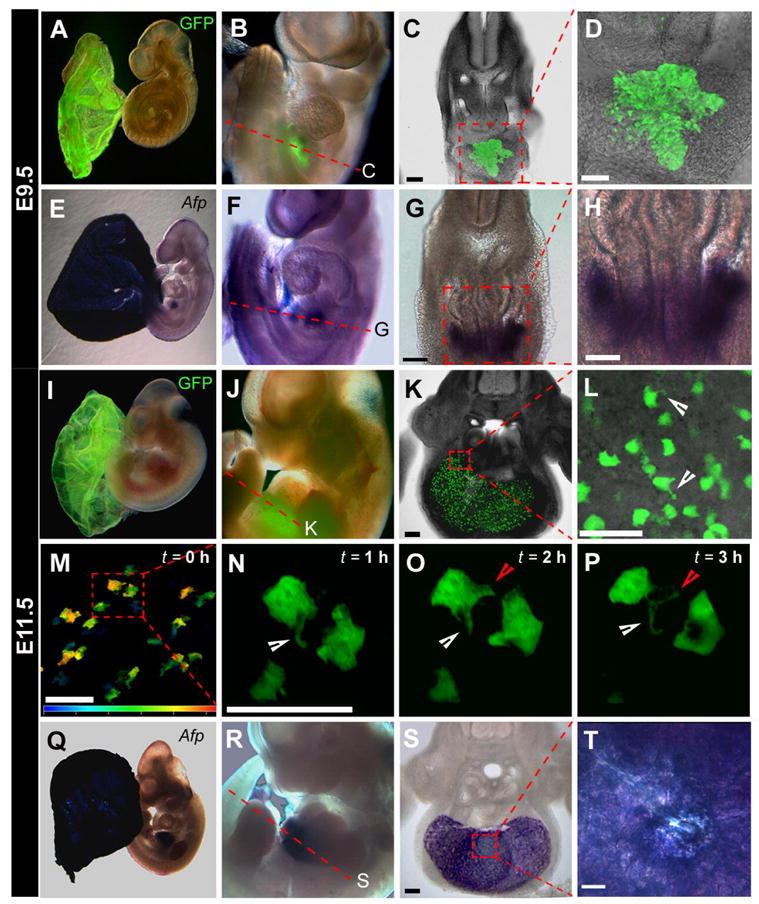
Tg(Afp-GFP) expression marks primitive and definitive endoderm lineages during mouse development
- PMID: 16708394
- PMCID: PMC1850385
- DOI: 10.1002/dvdy.20843
Tg(Afp-GFP) expression marks primitive and definitive endoderm lineages during mouse development
Abstract
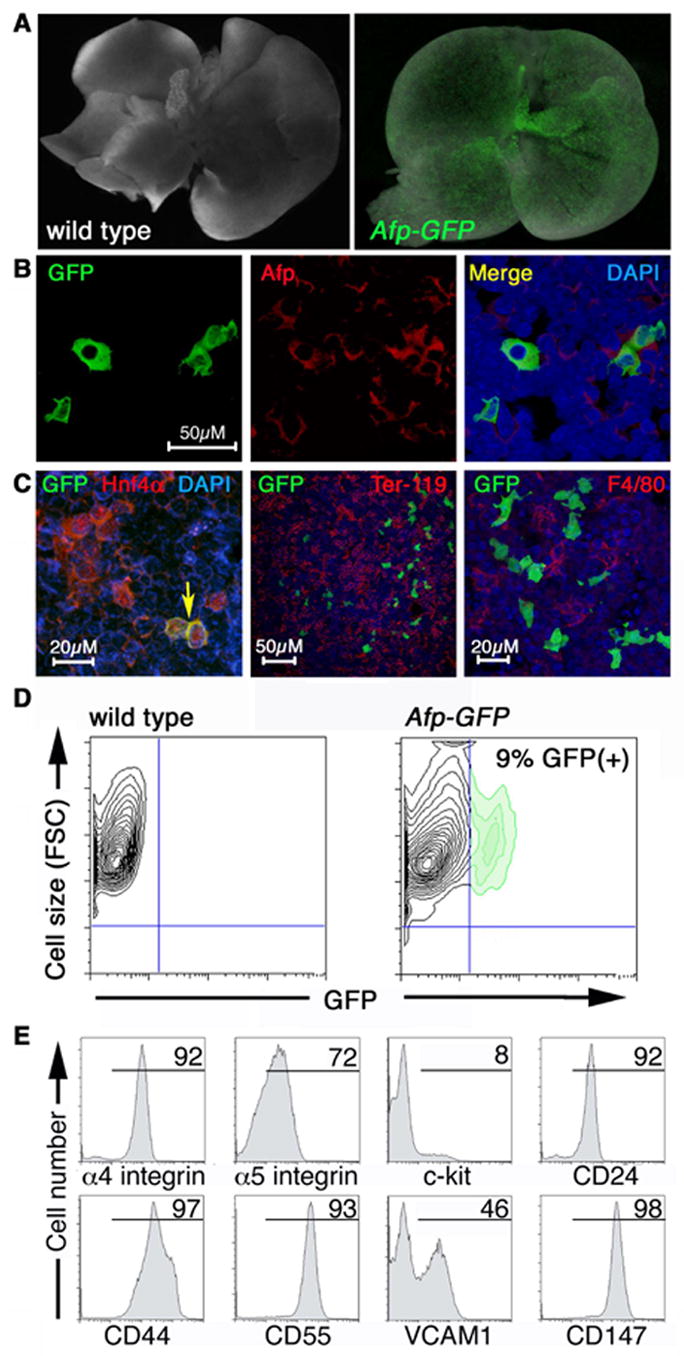
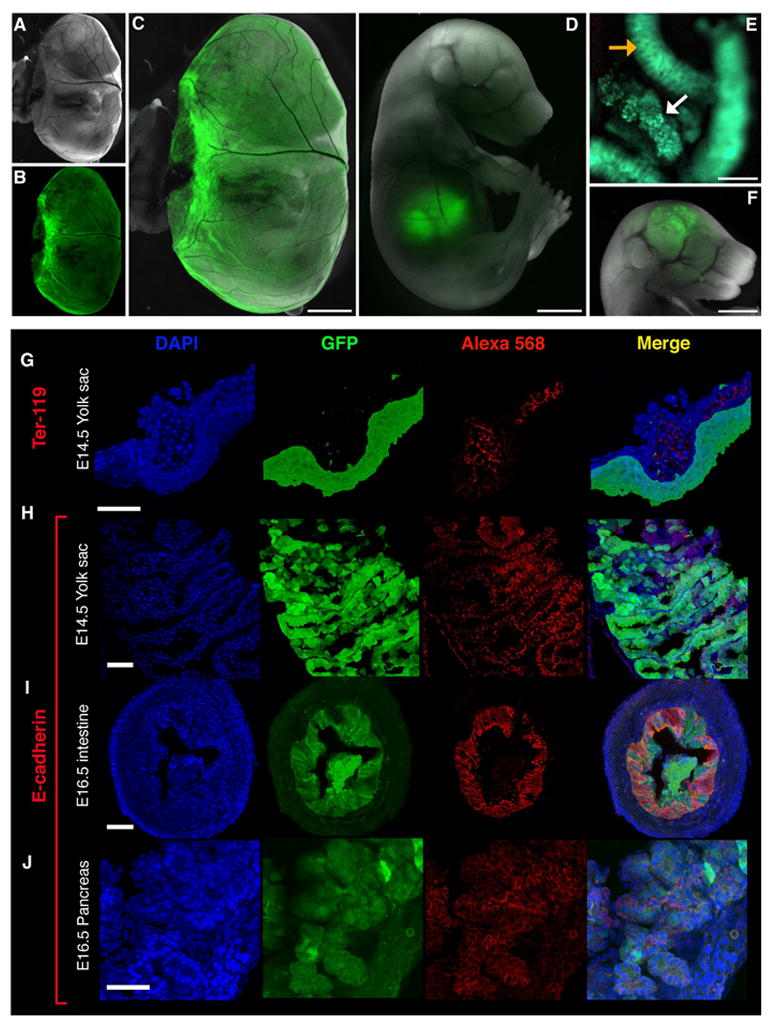
Alpha-fetoprotein (Afp) is the most abundant serum protein in the developing embryo. It is secreted by the visceral endoderm, its derivative yolk sac endoderm, fetal liver hepatocytes, and the developing gut epithelium. The abundance of this protein suggested that Afp gene regulatory elements might serve to effectively drive reporter gene expression in developing endodermal tissues. To this end, we generated transgenic mouse lines Tg(Afp-GFP) using an Afp promoter/enhancer to drive expression of green fluorescent protein (GFP). Bright GFP fluorescence allowed the visualization, in real time, of visceral endoderm, yolk sac endoderm, fetal liver hepatocytes, and the epithelium of the gut and pancreas. Comparison of the localization of green fluorescence with that of endogenous Afp transcripts and protein indicated that the regulatory elements used to generate these mouse lines directed transgene expression in what appeared to be all Afp-expressing cells of the embryo, but only in a subset of fetal liver cells. The bright GFP signal permitted flow cytometric analysis of fetal liver hepatocytes. These mice represent a valuable resource for live imaging as well as identification, quantitation, and isolation of cells from the primitive and definitive endoderm lineages of the developing mouse embryo.
Copyright 2006 Wiley-Liss, Inc.
Figures
Similar articles
-
Afp::mCherry, a red fluorescent transgenic reporter of the mouse visceral endoderm.Genesis. 2011 Mar;49(3):124-33. doi: 10.1002/dvg.20695. Epub 2011 Jan 5. Genesis. 2011. PMID: 21442721 Free PMC article.
-
Rat yolk sac explants as a system for studying the regulation of endodermal genes: down-regulation of the alpha-fetoprotein gene by dexamethasone and phorbol ester.Eur J Cell Biol. 1998 Apr;75(4):375-82. doi: 10.1016/s0171-9335(98)80071-x. Eur J Cell Biol. 1998. PMID: 9628324
-
Rat alpha-fetoprotein promoter and proximal enhancer direct expression of the nls-lacZ reporter gene in embryonic yolk sac, gut, and eustachian canal of transgenic mice.Tumour Biol. 2000 Sep-Oct;21(5):278-87. doi: 10.1159/000030133. Tumour Biol. 2000. PMID: 10940824
-
Molecular mechanisms of alpha-fetoprotein gene expression.Biochemistry (Mosc). 2000 Jan;65(1):117-33. Biochemistry (Mosc). 2000. PMID: 10702646 Review.
-
Cellular aspects of alpha-fetoprotein reexpression in tumors.Semin Cancer Biol. 1999 Apr;9(2):95-107. doi: 10.1006/scbi.1998.0084. Semin Cancer Biol. 1999. PMID: 10202131 Review.
Cited by
-
High glucose impairs osteogenic differentiation of embryonic stem cells via early diversion of beta-catenin from Forkhead box O to T cell factor interaction.Birth Defects Res. 2022 Oct 1;114(16):1056-1074. doi: 10.1002/bdr2.2085. Epub 2022 Sep 26. Birth Defects Res. 2022. PMID: 36164276 Free PMC article.
-
An engineered multicellular stem cell niche for the 3D derivation of human myogenic progenitors from iPSCs.EMBO J. 2022 Jul 18;41(14):e110655. doi: 10.15252/embj.2022110655. Epub 2022 Jun 15. EMBO J. 2022. PMID: 35703167 Free PMC article.
-
Initial Characterization of 3D Culture of Yolk Sac Tissue.Animals (Basel). 2023 Apr 22;13(9):1435. doi: 10.3390/ani13091435. Animals (Basel). 2023. PMID: 37174472 Free PMC article.
-
Afp::mCherry, a red fluorescent transgenic reporter of the mouse visceral endoderm.Genesis. 2011 Mar;49(3):124-33. doi: 10.1002/dvg.20695. Epub 2011 Jan 5. Genesis. 2011. PMID: 21442721 Free PMC article.
-
Journey of the mouse primitive endoderm: from specification to maturation.Philos Trans R Soc Lond B Biol Sci. 2022 Dec 5;377(1865):20210252. doi: 10.1098/rstb.2021.0252. Epub 2022 Oct 17. Philos Trans R Soc Lond B Biol Sci. 2022. PMID: 36252215 Free PMC article. Review.
References
-
- Andrews GK, Dziadek M, Tamaoki T. Expression and methylation of the mouse alpha-fetoprotein gene in embryonic, adult, and neoplastic tissues. J Biol Chem. 1982;257:5148–5153. - PubMed
-
- Belaoussoff M. Molecular and Cellular Biology. Cambridge, MA: Harvard University; 1998a. Embryonic Induction of Hematopoiesis and Vasculogenesis During Mouse Development.
-
- Belaoussoff M. Embryonic Induction of Hematopoiesis and Vasculogenesis During Mouse Development. Cambridge, MA: Ph.D. Thesis, Harvard University; 1998b.
-
- Berditchevski F, Chang S, Bodorova J, Hemler ME. Generation of monoclonal antibodies to integrin-associated proteins. Evidence that alpha3beta1 complexes with EMMPRIN/basigin/OX47/M6. J Biol Chem. 1997;272:29174–82910. - PubMed
-
- Cho JY, Fox DA, Horejsi V, Sagawa K, Skubitz KM, Katz DR, Chain B. The functional interactions between CD98, beta1-integrins, and CD147 in the induction of U937 homotypic aggregation. Blood. 2001;98:374–382. - PubMed
Publication types
MeSH terms
Substances
Grants and funding
LinkOut - more resources
Full Text Sources
Molecular Biology Databases
Research Materials
Miscellaneous
