. 2006 Jun;36(6):1374-85.
doi: 10.1002/eji.200635883.

Persistent antigenic stimulation alters the transcription program in T cells, resulting in antigen-specific tolerance

Affiliations

Persistent antigenic stimulation alters the transcription program in T cells, resulting in antigen-specific tolerance

Per O Anderson et al. Eur J Immunol. 2006 Jun.

Abstract

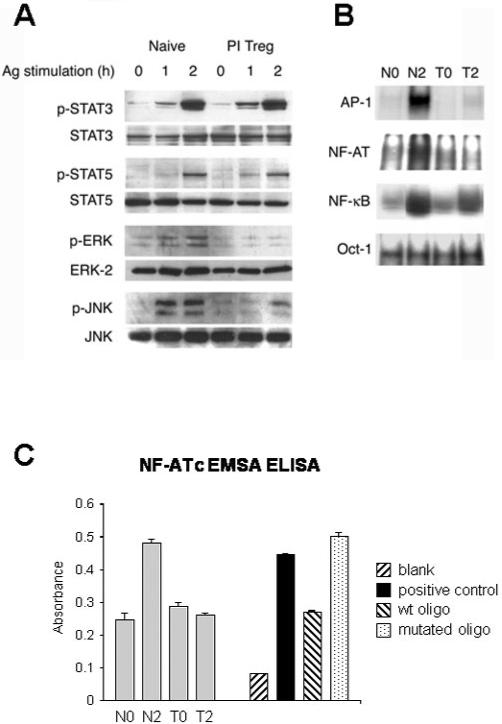
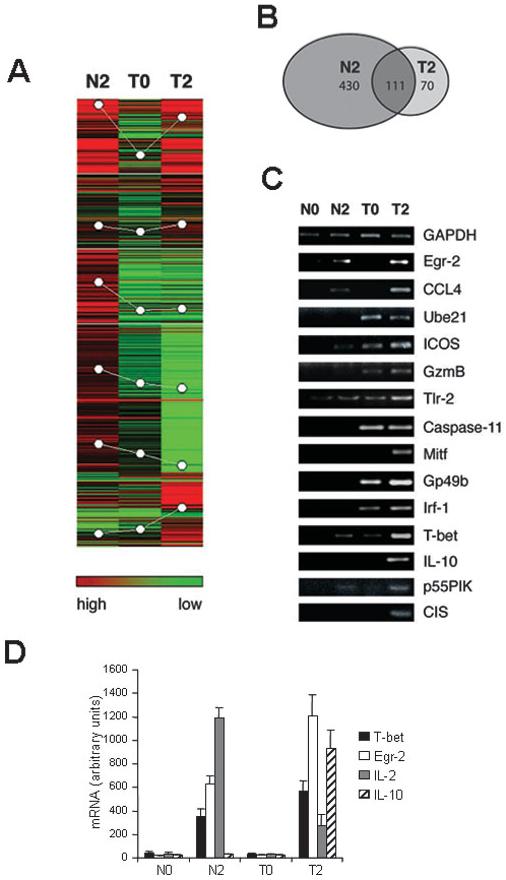
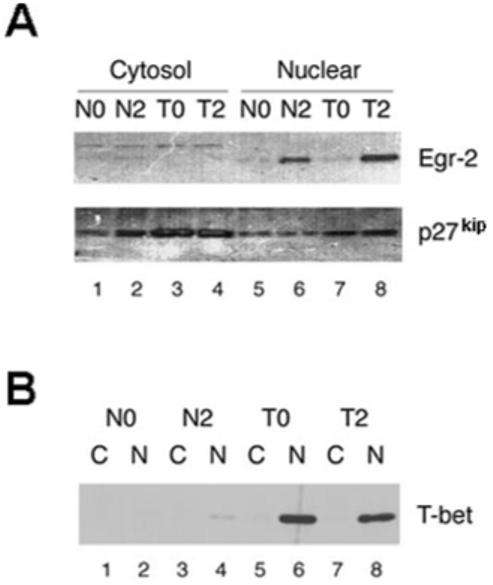
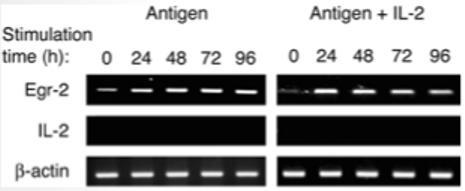
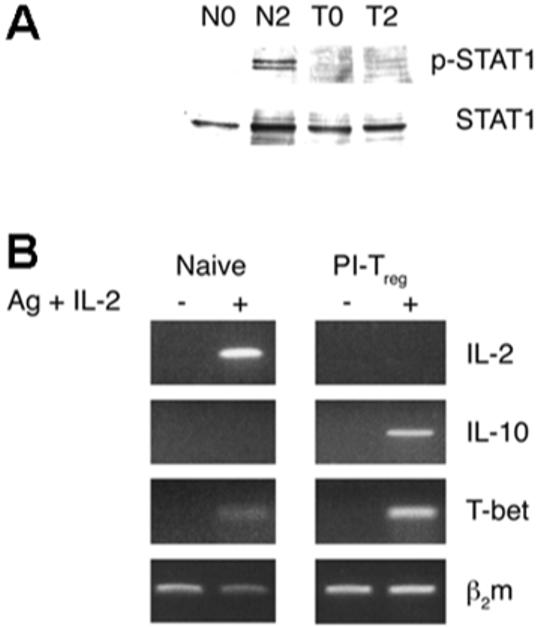
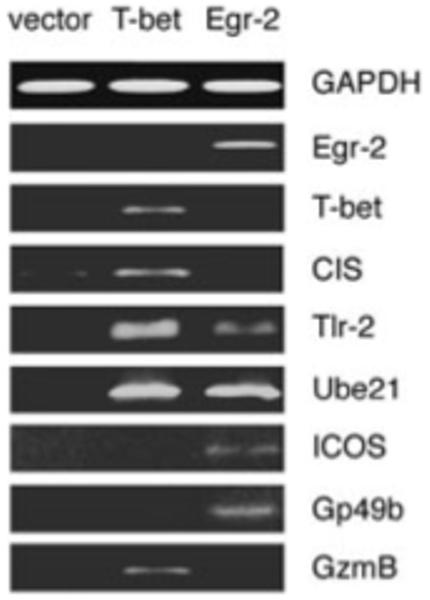
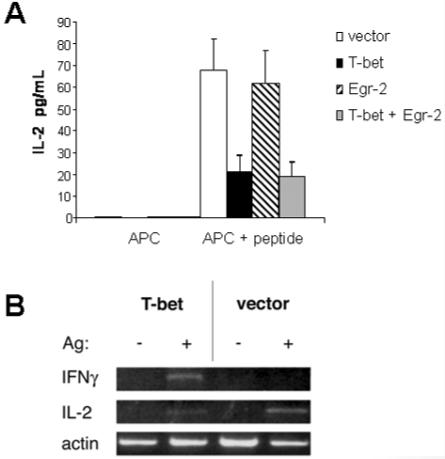
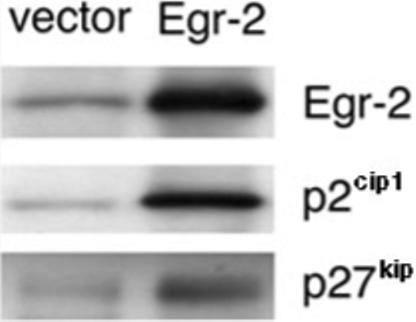
Repetitive antigen stimulation induces peripheral T cell tolerance in vivo. It is not known, however, whether multiple stimulations merely suppress T cell activation or, alternatively, change the transcriptional program to a distinct, tolerant state. In this study, we have discovered that STAT3 and STAT5 were activated in response to antigen stimulation in vivo, in marked contrast to the suppression of AP-1, NF-kappaB and NFAT. In addition, a number of transcription factors were induced in tolerant T cells following antigen challenge in vivo, including T-bet, Irf-1 and Egr-2. The altered transcription program in tolerant cells associates closely with the suppression of cell cycle progression and IL-2 production, as well as with the induction of IL-10. Studies of T-bet and Egr-2 show that the function of T-bet in peptide treatment-induced regulatory T cells is not associated with Th1 differentiation, but correlates with the suppression of IL-2, whereas expression of Egr-2 led to an up-regulation of the cell cycle inhibitors p21(cip1) and p27(kip). Our results demonstrate a balanced transcription program regulated by different transcription factors for T cell activation and/or tolerance during antigen-induced T cell responses. Persistent antigen stimulation can induce T cell tolerance by changing the balance of transcription factors.


Figures

Figure 1
Figure 1
Differential activation of cytokine and T cell receptor signaling pathways in naive and PI-Treg cells. Total CD4+ T cells were isolated from splenocytes of naive or tolerant mice before or 2 h after intranasal stimulation with Ac1-9[4Y]. (A) Activation of STAT and MAP kinases was assessed by immunoblotting with phospho-specific antibodies as indicated. Abundance of STAT3, STAT5, ERK and JNK was quantified by specific antisera for equal loading of protein. Nuclear extracts were analyzed by EMSA (B) using 32P-labeled probes for NFAT, NF-κB, AP-1 and Oct-1 or by ELISA for NFAT (C). The results shown are representative of three separate experiments.
Figure 2
Figure 2
Transcription profile of global gene expression in naive and PI-Treg cells after antigenic stimulation. (A) Total CD4+ T cells were isolated from splenocytes of naive or tolerant mice before or 2 h after intranasal stimulation with Ac1-9[4Y] in vivo. Total RNA was extracted and used for labeling and hybridization against a 15 K mouse gene array and/or a 10 K oligo array derived from known mouse genes as described in Materials and methods. An equal amount of the Cy3-labeled N0 sample was mixed with the same amount of Cy5-labeled samples from N2, T0 and T2 before hybridization with the array as described in Materials and methods. Data was submitted to analysis by the Genepix Pro 4.1 program and clustering with Acuity 3.1 software. The number of induced genes is presented in (A) and (B). Similar results were obtained in three separate array experiments. (C) Expression of 15 of the 71 genes induced in T2 samples was analyzed by semiquantitative PCR for N0, N2, T0 and T2 samples. (D) Expression of IL-2, IL-10, Egr-2 and T-bet was further analyzed by real-time PCR. The expression levels were normalized against the housekeeping gene GAPDH. The results displayed are mean values of three different experiments.
Figure 3
Figure 3
T-bet and Egr-2 were detected in the nuclear extracts of PI-Treg cells and associated with the induction of p27kip. Cytosolic and nuclear proteins were extracted from CD4 T cells from naive and tolerant mice before and after stimulation with Ac1-9[4Y] for 2 h. Western blots were stained with antisera specific for (A) Egr-2, p27kip and (B) T-bet, respectively, as indicated. The cytosolic and nuclear extracts in (B) are indicated as C and N. The results shown are representative of three separate experiments.
Figure 4
Figure 4
Egr-2 expression in PI-Treg cells following exposure to antigen and antigen + IL-2. Splenocytes from naive and tolerant mice were cultured with Ac1-9[4 K] peptide (10 μg/mL) or peptide + IL-2 (20 U/mL) for 24 h. CD4+ cells were purified from splenocyte cultures using CD4+ microbeads and total RNA was extracted. Transcripts of Egr-2 and IL-2 were semiquantitated by RT-PCR. RT-PCR of β-actin served as loading control. These results were similar in three separate experiments.
Figure 5
Figure 5
Activation of the STAT1 pathway and expression of T-bet, IL-2 and IL-10 in naive and PI-Treg cells in the presence of IL-2. CD4+ T cells were isolated from the spleens of naive and tolerant mice 2 h before and after antigen stimulation in vivo. Total cellular lysates were analyzed for STAT1 activation by phospho-STAT1-specific antibody (A). In addition, the naive and PI-Treg cells purified before antigen stimulation were treated in vitro with or without IL-2 (10 U/mL) for 24 h. The T cells were isolated by anti-CD4 antibody-coated beads and submitted to semiquantitative PCR for IL-2, IL-10 and T-bet (B). β2 m served as loading control. These results were consistent in three separate experiments.
Figure 6
Figure 6
Induction of tolerance-associated genes in T-bet- or Egr-2-expressing T cells. MF2.2D9 T cells transfected with control vector, Egr-2 or T-bet, respectively, were submitted to analysis of expression of the 14 tolerance-associated genes shown in Fig. 2. Expression of the eight detected genes is shown. GAPDH served as loading control.
Figure 7
Figure 7
Overexpression of T-bet increases expression of IFN-γ but inhibits IL-2 production. T cell hybridoma MF2.2D9 was transfected with vector, T-bet, Egr-2 or Egr-2 + T-bet. The transfectants were stimulated with the DC line alone or DC + antigen (Ag) for 24 h. Production of IL-2 was measured by ELISA (A). The expression of IL-2 and IFN-γ was analyzed by semiquantitative PCR (B). Actin served as a control for total RNA used. The results are representative of three similar experiments.
Figure 8
Figure 8
Induction of p21cip1 and p27kip in Egr-2-expressing T cells. MF2.29D T cells were transfected with Egr-2 or control vector. The transfectants were analyzed for p21cip1 and p27kip expression by immunoblotting with specific antisera as described in Materials and methods.

References

    1. Faria AM, Weiner HL. Oral tolerance: Mechanisms and therapeutic applications. Adv. Immunol. 1999;73:153–264. - PubMed
    1. Chen Y, Kuchroo VK, Inobe J-I, Hafler DA, Weiner HL. Regulatory T cell clones induced by oral tolerance: Suppression of autoimmune encephalomyelitis. Science. 1994;265:1237–1240. - PubMed
    1. Larche M, Wraith DC. Peptide-based therapeutic vaccines for allergic and autoimmune diseases. Nat. Med. 2005;11:S69–S76. - PubMed
    1. Groux H, O’Garra A, Bigler M, Rouleau M, Antonenko S, de Vries J, Roncarolo MG. ACD4+ T-cell subset inhibits antigen-specific T-cell responses and prevents colitis. Nature. 1997;389:737–742. - PubMed
    1. Barrat FJ, Cua DJ, Boonstra A, Richards DF, Crain C, Savelkoul HF, de Waal-Malefyt R, et al. In vitro generation of interleukin 10-producing regulatory CD4(+) T cells is induced by immunosuppressive drugs and inhibited by T helper type 1 (Th1)- and Th2-inducing cytokines. J. Exp. Med. 2002;195:603–616. - PMC - PubMed

Publication types

MeSH terms

LinkOut - more resources