. 2005;2(1):1-16.

Shear force at the cell-matrix interface: enhanced analysis for microfabricated post array detectors

Affiliations

Shear force at the cell-matrix interface: enhanced analysis for microfabricated post array detectors

Christopher A Lemmon et al. Mech Chem Biosyst. 2005.

Abstract

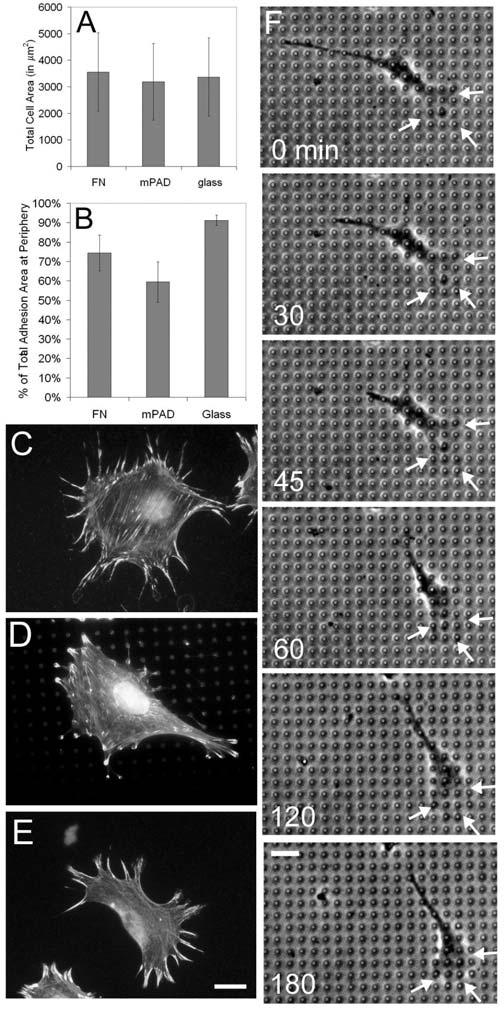
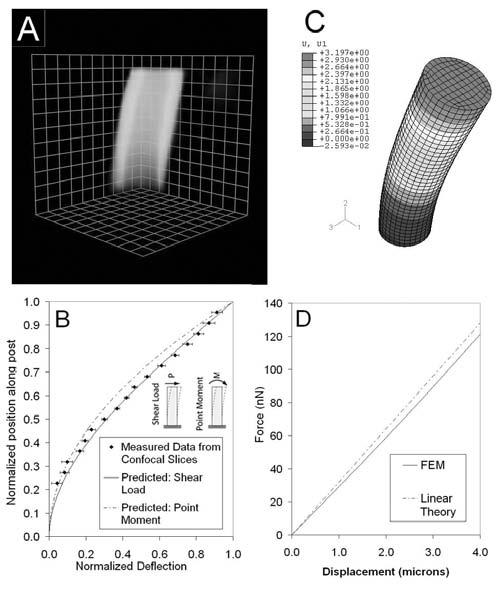
The interplay of mechanical forces between the extracellular environment and the cytoskeleton drives development, repair, and senescence in many tissues. Quantitative definition of these forces is a vital step in understanding cellular mechanosensing. Microfabricated post array detectors (mPADs) provide direct measurements of cell-generated forces during cell adhesion to extracellular matrix. A new approach to mPAD post labeling, volumetric imaging, and an analysis of post bending mechanics determined that cells apply shear forces and not point moments at the matrix interface. In addition, these forces could be accurately resolved from post deflections by using images of post tops and bases. Image analysis tools were then developed to increase the precision and throughput of post centroid location. These studies resulted in an improved method of force measurement with broad applicability and concise execution using a fully automated force analysis system. The new method measures cell-generated forces with less than 5% error and less than 90 seconds of computational time. Using this approach, we demonstrated direct and distinct relationships between cellular traction force and spread cell surface area for fibroblasts, endothelial cells, epithelial cells and smooth muscle cells.


Figures

Figure 1
Figure 1
Cell spreading, focal adhesion distribution, and cell motility on the discontinuous mPAD surface. (A) Surface area data, and (B) Peripheral adhesion data, for MEF cultured on glass coverslips with adsorbed fibronectin, mPADs microcontact printed with fibronectin, and uncoated glass coverslips. (C-E) Composite Actin (dark) and Vinculin (bright) images from MEF cultured on glass coverslips with adsorbed fibronectin (C), mPADs microcontact printed with fibronectin (D), and uncoated glass coverslips (E). Scale bar for C,D,E = 20 μm. (F) A series of six time-lapse images of a BAMEC migrating on an mPAD. Scale bar for F = 20 μm.
Figure 2
Figure 2
A new approach to post labeling. (A) A 3D-reconstruction of a cell plated onto an mPAD shows f-actin (dark gray, surface) and BSA-488 (light gray, posts). Each unit of the grid denotes 10 microns. (B) An immunofluorescence image of a cell plated on an mPAD shows f-actin (dark gray) and fibronectin (light gray) printed onto the top surface of mPAD posts. Note that immunofluorescence staining of fibronectin includes both microcontact-printed fibronectin and intracellular fibronectin. (C) In the T-I Method, unoccupied posts along the image edge (gray) are used to determine the linear edges (solid lines) of the ideal grid. Deflections of occupied posts (white) are calculated based on the differences between the actual centroids (center dot) and the theoretical undeflected centroids (intersections of dashed lines). (D) Schematic of new mPAD surface preparation.
Figure 3
Figure 3
Mechanical analysis of post deflections. (A) A Volocity 3D-reconstruction of a deflected mPAD post. Measurements of centroids were calculated at 0.5 micron increments along the post length from the top surface to 1.5 microns above the base surface. Grid blocks are 1 micron × 1 micron. (B) Normalized deflection vs. normalized length along an mPAD post for 2 cases: post under shear load (solid), and post under top surface moment (dashed). Measured centroid positions from confocal slicing are shown as black diamonds. (C) An FEM model of a shear force applied to an mPAD post surface. (D) Applied force as a function of deflection for linear theory (dashed) and FEM analysis (solid).
Figure 4
Figure 4
Comparison of accuracy of T-I method and T-B method. (A) The force map (arrows) result from the T-B method is shown superimposed with immunofluorescence images of f-actin, BSA-488 at the top surface of the mPAD (light gray), and BSA-488 at the base surface of the mPAD (dark gray). Deflections are calculated based on the difference in centroid position of each post ([C]T -[C]B) (arrows). White arrows represent deflections of cell-occupied posts, while gray arrows represent deflections of unoccupied posts. (B) Histogram of deflection magnitudes of unoccupied posts for T-I method (white) and T-B method (gray). Vertical lines represent 25 % of the average occupied post deflection (solid) and 50% of the average occupied post deflection (dashed). (C) Standard deviation from zero (σ) for deflections of unoccupied posts was calculated using the T-I method (35 images) and the T-B method (26 images).
Figure 5
Figure 5
Comparative analysis of approaches to identifying centroids of posts. An immunofluorescence image of the top surface of an mPAD (A) is analyzed using three different threshold algorithms: (B) the GT thresholding algorithm; (C) the LT1 algorithm; and (D) the LT2 algorithm. Lower arrows indicate an area of non-uniform illumination, which is not detected in the GT algorithm, but is detected in the LT1 and LT2 algorithms; upper arrows indicate an area of interfering fluorescence, which is not eliminated in the LT1 algorithm, but is eliminated in the GT and LT2 algorithms. Upper right boxes represent the size of the scanning-window used in the LT1 and LT2 algorithms. (E) Values of P (left y-axis), eccentricity (right y-axis), and change in centroid position (right y-axis) as functions of threshold, as calculated by the LT2 algorithm.
Figure 6
Figure 6
Comparison of cell-generated force for four cell types. Representative force analysis for (A) mouse embryo fibroblasts (MEF); (B) human umbilical vein endothelial cells (HUVEC); (C) human mammary epithelial cells (MCF10a); and (D) bovine aortic smooth muscle cells (SMC). (E) Total force (nN) per cell for each of the four cell types. (F) Total force (nN) as a function of total cell area (μm2) for the four cell types.

References

    1. Balaban NQ, Schwarz US, Riveline D, Goichberg P, Tzur G, Sabanay I, Mahalu D, Safran S, Bershadsky A, Addadi L, Geiger B. Force and focal adhesion assembly: a close relationship studied using elastic micropatterned substrates. Nat Cell Biol. 2001;3(5):466–72. - PubMed
    1. Beer F, Johnston E. Mechanics of Materials. McGraw-Hill, Inc.; 1981.
    1. Beningo KA, Dembo M, Kaverina I, Small JV, Wang YL. Nascent focal adhesions are responsible for the generation of strong propulsive forces in migrating fibroblasts. J Cell Biol. 2001;153(4):881–8. - PMC - PubMed
    1. Bershadsky AD, Balaban NQ, Geiger B. Adhesion-dependent cell mechanosensitivity. Annu Rev Cell Dev Biol. 2003;19:677–95. - PubMed
    1. Bogatcheva NV, Garcia JG, Verin AD. Molecular mechanisms of thrombin-induced endothelial cell permeability. Biochemistry (Mosc) 2002;67(1):75–84. - PubMed

Publication types

MeSH terms

LinkOut - more resources