Comparative Study
. 2006 May 18:7:257.
doi: 10.1186/1471-2105-7-257.

Use of a multi-way method to analyze the amino acid composition of a conserved group of orthologous proteins in prokaryotes

Affiliations
Comparative Study

Use of a multi-way method to analyze the amino acid composition of a conserved group of orthologous proteins in prokaryotes

Alberto Pasamontes et al. BMC Bioinformatics. .

Abstract

Background: Amino acids in proteins are not used equally. Some of the differences in the amino acid composition of proteins are between species (mainly due to nucleotide composition and lifestyle) and some are between proteins from the same species (related to protein function, expression or subcellular localization, for example). As several factors contribute to the different amino acid usage in proteins, it is difficult both to analyze these differences and to separate the contributions made by each factor.

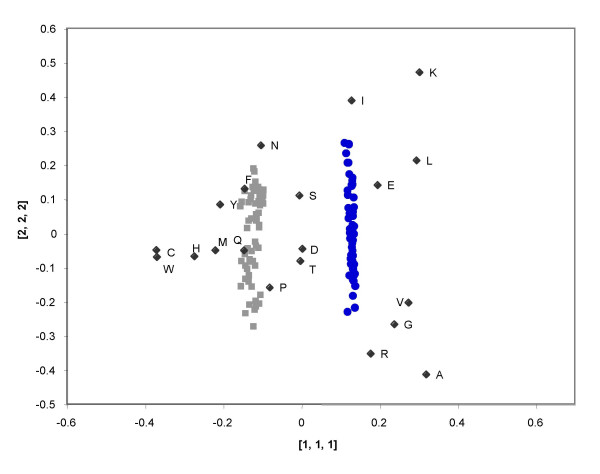
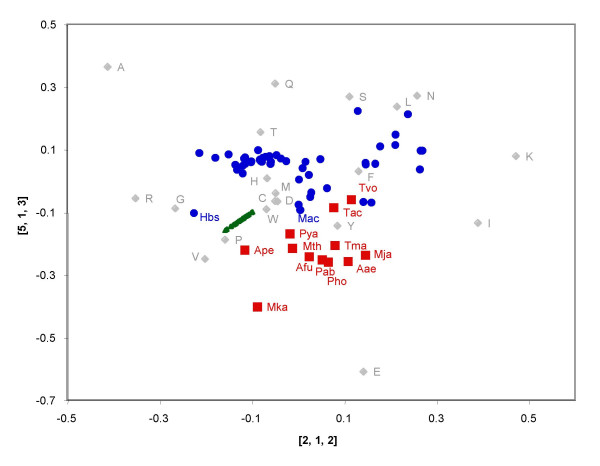
Results: Using a multi-way method called Tucker3, we have analyzed the amino composition of a set of 64 orthologous groups of proteins present in 62 archaea and bacteria. This dataset corresponds to essential proteins such as ribosomal proteins, tRNA synthetases and translational initiation or elongation factors, which are common to all the species analyzed. The Tucker3 model can be used to study the amino acid variability within and between species by taking into consideration the tridimensionality of the data set. We found that the main factor behind the amino acid composition of proteins is independent of the organism or protein function analyzed. This factor must be related to the biochemical characteristics of each amino acid. The difference between the non-ribosomal proteins and the ribosomal proteins (which are rich in arginine and lysine) is the main factor behind the differences in amino acid composition within species, while G+C content and optimal growth temperature are the main factors behind the differences in amino acid usage between species.

Conclusion: We show that a multi-way method is useful for comparing the amino acid composition of several groups of orthologous proteins from the same group of species. This kind of dataset is extremely useful for detecting differences between and within species.


Figures

Figure 1
Figure 1
Triplot of [1, 1, 1] and [2, 2, 2] factors. Superimposed plot of the [1, 1, 1] and [2, 2, 2] factors showing the amino acid usage variability, independent of the organisms or functions analyzed. This is a combination of three plots: a) a plot of the first and second principal components of the loadings matrix, A, related to amino acid variation; b) a plot of the first and second principal components of the loadings matrix, B, related to variations associated with functions; and c) a plot of the first and second principal components of the loadings matrix, C, related to variations associated with the organism. The blue circles and grey squares represent the organisms and functions, respectively.
Figure 2
Figure 2
Triplot of [3, 2, 1] and [4, 3, 1] factors. Superimposed plot of the [3, 2, 1] and [4, 3, 1] factors showing the amino acid usage variability related to protein function. The red squares and blue circles represent ribosomal and non-ribosomal proteins, respectively. The green triangles represent the loadings matrix of the organisms.
Figure 3
Figure 3
Triplot of [2, 1, 2] and [5, 1, 3] factors. Superimposed plot of the [2, 1, 2] and [5, 1, 3] factors showing the amino acid usage variability related to organisms. The red squares and blue circles represent thermophile and non-thermophile organisms, respectively. The green triangles represent the loadings matrix related to protein function. The abbreviations used in this figure are: Hbs, Halobacterium sp; Ape, Aeropyrum pernix; Mka, Methanopyrus kandleri; Mac, Methanosarcina acetivorans; Pya, Pyrobaculum aerophilum; Mth, Methanobacterium thermoautotrophicum; Afu, Archaeoglobus fulgidus; Pab, Pyrococcus abyssi; Pho, Pyrococcus horikoshii; Mja, Methanococcus jannaschii; Aae, Aquifex aeolicus; Tma, Thermotoga maritima; Tac, Thermoplasma acidophilum and Tvo, Thermoplasma volcanicum.
Figure 4
Figure 4
The 3-way Tucker3 model. The Tucker3 algorithm decomposes a three-dimensional matrix, X, into a matrix of residuals, E, three component matrices A, B, C called loadings matrices, and a 3-way core array, G. The X matrix of order (20 × 64 × 62) is the input of the algorithm and contains the frequency with which amino acid is used in each group of orthologous proteins and in each organism. The loadings matrices A, B and C are similar to the scores or loadings matrices in standard PCA and contain the projections of the X matrix in the representative principal factors. The core array, G, defines how the individual loadings vectors interact. See the Methods section and reference [43] for more details about the Tucker3 model.

References

    1. Rispe C, Delmotte F, van Ham RCHJ, Moya A. Mutational and selective pressures on codon and amino acid usage in Buchnera, endosymbiotic bacteria of aphids. Genome Res. 2004;14:44–53. doi: 10.1101/gr.1358104. - DOI - PMC - PubMed
    1. Mackiewicz P, Gierlik A, Kowalczuk M, Dudek MR, Cebrat S. How does replication-associated mutational pressure influence amino acid composition of proteins? Genome Res. 1999;9:409–416. - PMC - PubMed
    1. Rocha EPC, Danchin A, Viari A. Universal replication biases in bacteria. Mol Microbiol. 1999;32:11–16. doi: 10.1046/j.1365-2958.1999.01334.x. - DOI - PubMed
    1. Krogh A, Larsson B, von Heijne G, Sonnhammer ELL. Predicting transmembrane protein topology with a hidden markov model: application to complete genomes. J Mol Biol. 2001;305:567–580. doi: 10.1006/jmbi.2000.4315. - DOI - PubMed
    1. Fujiwara Y, Asogawa M. Prediction of subcellular localizations using amino acid composition and order. Genome Informatics. 2001;12:103–112. - PubMed

Publication types

MeSH terms