

Cellular response to 5-fluorouracil (5-FU) in 5-FU-resistant colon cancer cell lines during treatment and recovery
- PMID: 16709241
- PMCID: PMC1524802
- DOI: 10.1186/1476-4598-5-20
Cellular response to 5-fluorouracil (5-FU) in 5-FU-resistant colon cancer cell lines during treatment and recovery
Abstract
Background: Treatment of cells with the anti-cancer drug 5-fluorouracil (5-FU) causes DNA damage, which in turn affects cell proliferation and survival. Two stable wild-type TP53 5-FU-resistant cell lines, ContinB and ContinD, generated from the HCT116 colon cancer cell line, demonstrate moderate and strong resistance to 5-FU, respectively, markedly-reduced levels of 5-FU-induced apoptosis, and alterations in expression levels of a number of key cell cycle- and apoptosis-regulatory genes as a result of resistance development. The aim of the present study was to determine potential differential responses to 8 and 24-hour 5-FU treatment in these resistant cell lines. We assessed levels of 5-FU uptake into DNA, cell cycle effects and apoptosis induction throughout treatment and recovery periods for each cell line, and alterations in expression levels of DNA damage response-, cell cycle- and apoptosis-regulatory genes in response to short-term drug exposure.
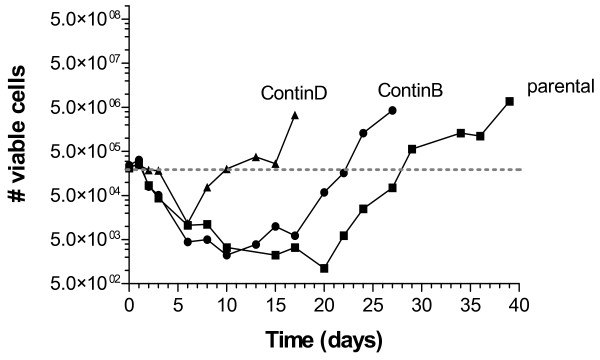
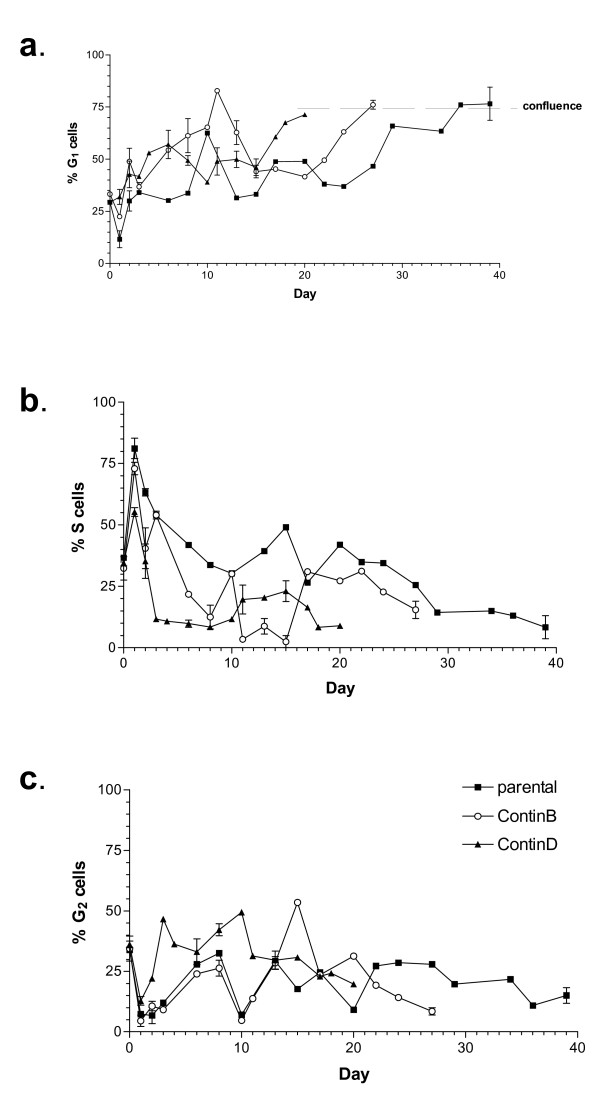
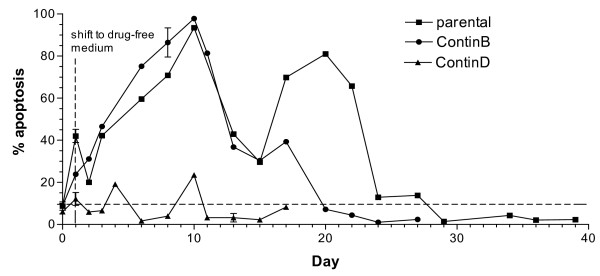
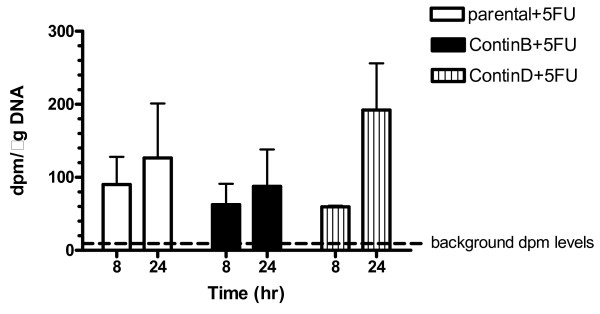
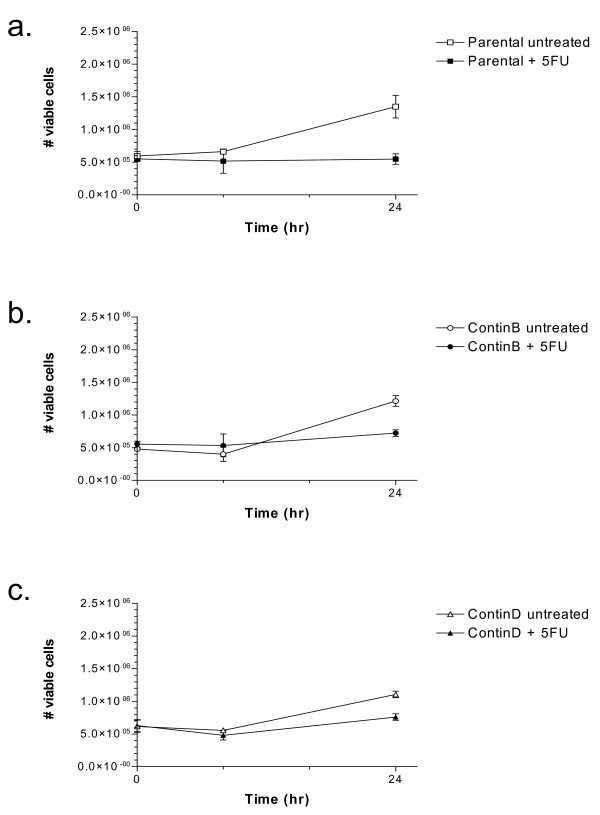
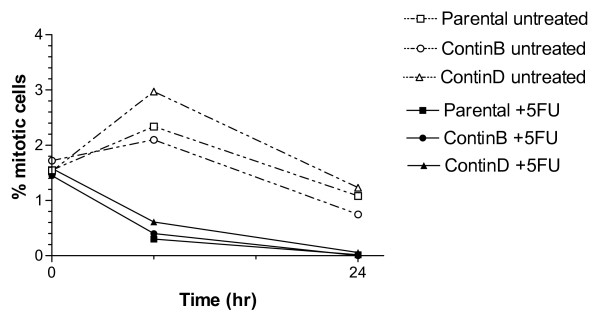
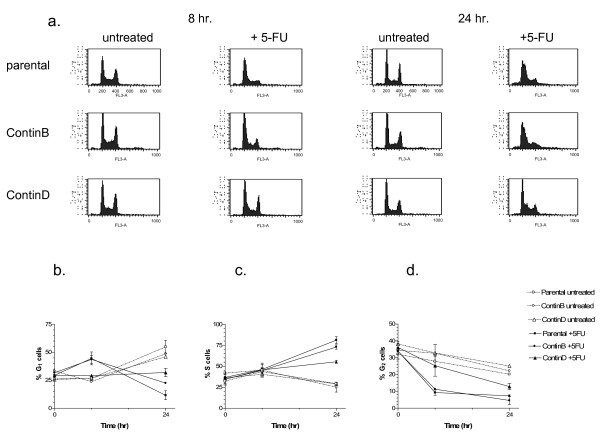
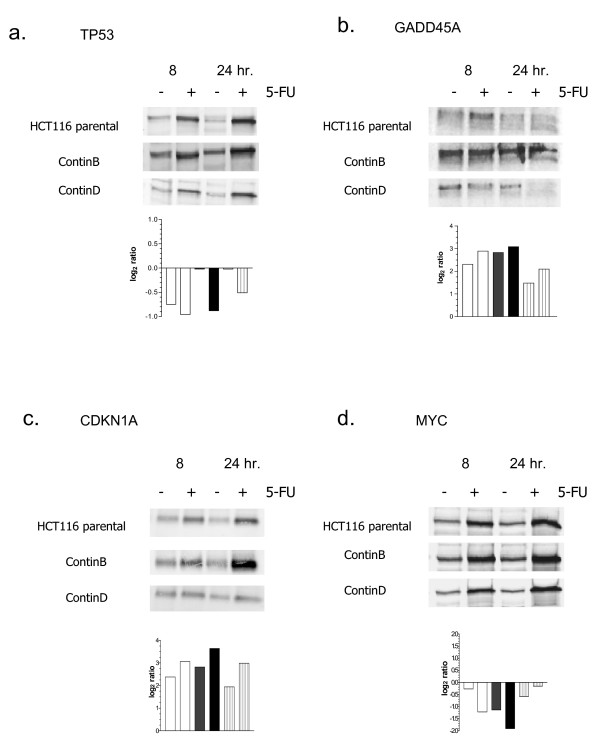
Results: 5-FU treatment for 24 hours resulted in S phase arrests, p53 accumulation, up-regulation of p53-target genes on DNA damage response (ATF3, GADD34, GADD45A, PCNA), cell cycle-regulatory (CDKN1A), and apoptosis-regulatory pathways (FAS), and apoptosis induction in the parental and resistant cell lines. Levels of 5-FU incorporation into DNA were similar for the cell lines. The pattern of cell cycle progression during recovery demonstrated consistently that the 5-FU-resistant cell lines had the smallest S phase fractions and the largest G2(/M) fractions. The strongly 5-FU-resistant ContinD cell line had the smallest S phase arrests, the lowest CDKN1A levels, and the lowest levels of 5-FU-induced apoptosis throughout the treatment and recovery periods, and the fastest recovery of exponential growth (10 days) compared to the other two cell lines. The moderately 5-FU-resistant ContinB cell line had comparatively lower apoptotic levels than the parental cells during treatment and recovery periods and a recovery time of 22 days. Mitotic activity ceased in response to drug treatment for all cell lines, consistent with down-regulation of mitosis-regulatory genes. Differential expression in response to 5-FU treatment was demonstrated for genes involved in regulation of nucleotide binding/metabolism (ATAD2, GNL2, GNL3, MATR3), amino acid metabolism (AHCY, GSS, IVD, OAT), cytoskeleton organization (KRT7, KRT8, KRT19, MAST1), transport (MTCH1, NCBP1, SNAPAP, VPS52), and oxygen metabolism (COX5A, COX7C).
Conclusion: Our gene expression data suggest that altered regulation of nucleotide metabolism, amino acid metabolism, cytoskeleton organization, transport, and oxygen metabolism may underlie the differential resistance to 5-FU seen in these cell lines. The contributory roles to 5-FU resistance of some of the affected genes on these pathways will be assessed in future studies.
Figures
References
-
- Shah MA, Schwartz GK. Cell cycle-mediated drug resistance: an emerging concept in cancer therapy. Clin Cancer Res. 2001;7:2168–2181. - PubMed
-
- Curtin NJ, Harris AL, Aherne GW. Mechanism of cell death following thymidylate synthase inhibition: 2'-deoxyuridine-5'-triphosphate accumulation, DNA damage, and growth inhibition following exposure to CB3717 and dipyridamole. Cancer Res. 1991;51:2346–2352. - PubMed
-
- Peters GJ, van Triest B, Backus HH, Kuiper CM, van der Wilt CL, Pinedo HM. Molecular downstream events and induction of thymidylate synthase in mutant and wild-type p53 colon cancer cell lines after treatment with 5-fluorouracil and the thymidylate synthase inhibitor raltitrexed. Eur J Cancer. 2000;36:916–924. doi: 10.1016/S0959-8049(00)00026-5. - DOI - PubMed
Publication types
MeSH terms
Substances
LinkOut - more resources
Full Text Sources
Other Literature Sources
Molecular Biology Databases
Research Materials
Miscellaneous
