. 2006 Jul 15;574(Pt 2):477-89.
doi: 10.1113/jphysiol.2006.112193. Epub 2006 May 18.

Single-channel analysis of a point mutation of a conserved serine residue in the S2 ligand-binding domain of the NR2A NMDA receptor subunit

Affiliations

Single-channel analysis of a point mutation of a conserved serine residue in the S2 ligand-binding domain of the NR2A NMDA receptor subunit

David J A Wyllie et al. J Physiol. .

Abstract

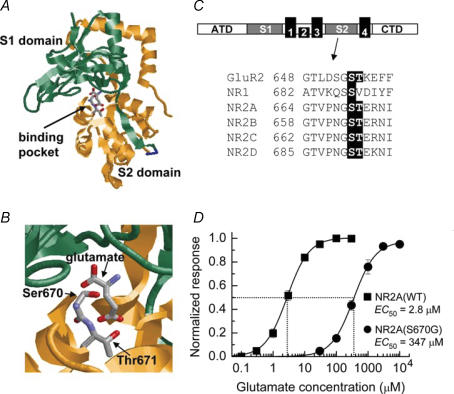
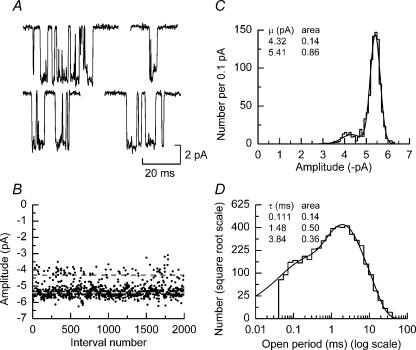
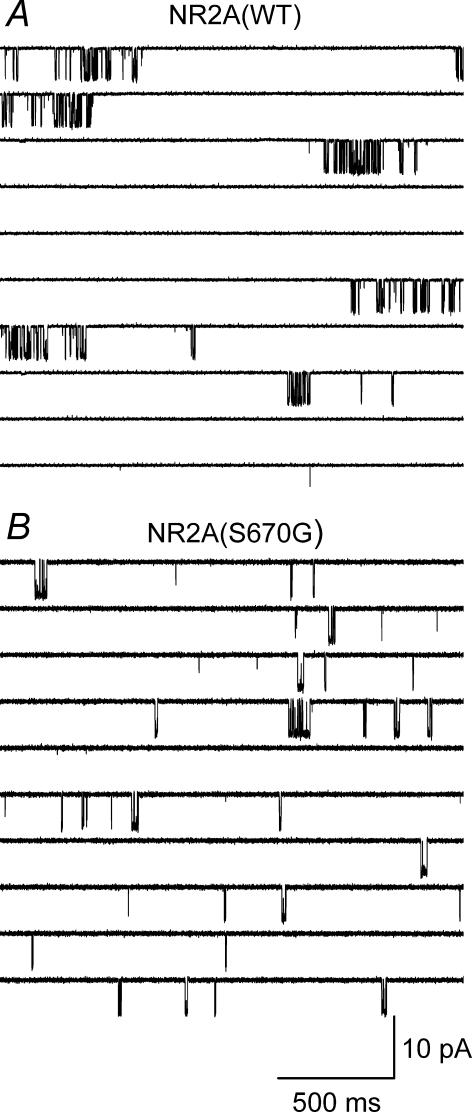
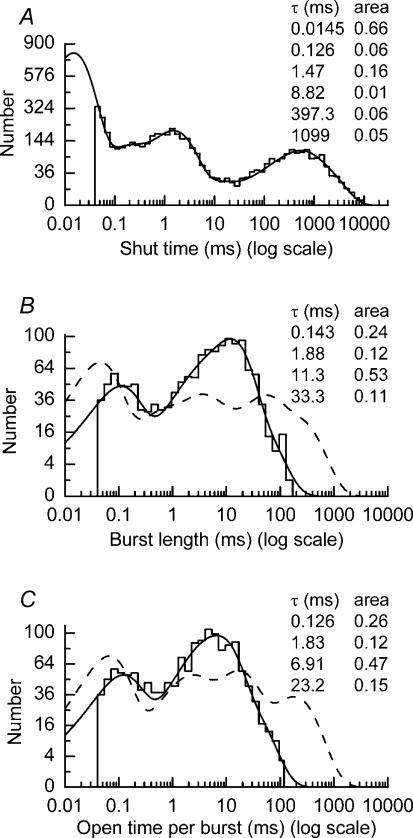
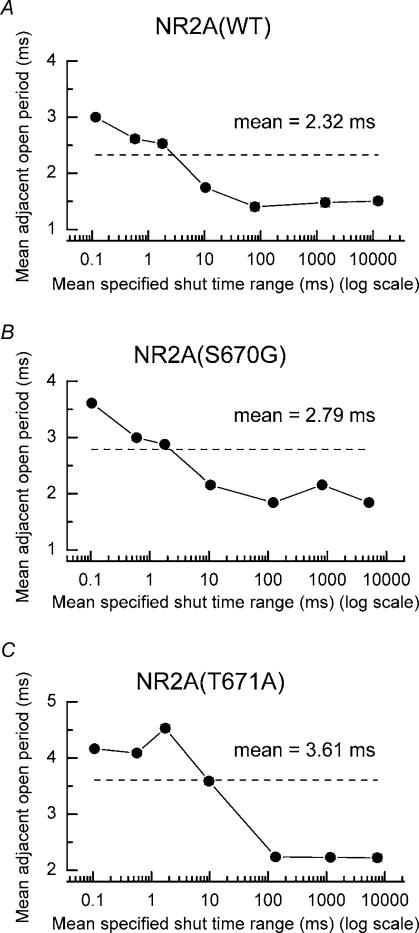
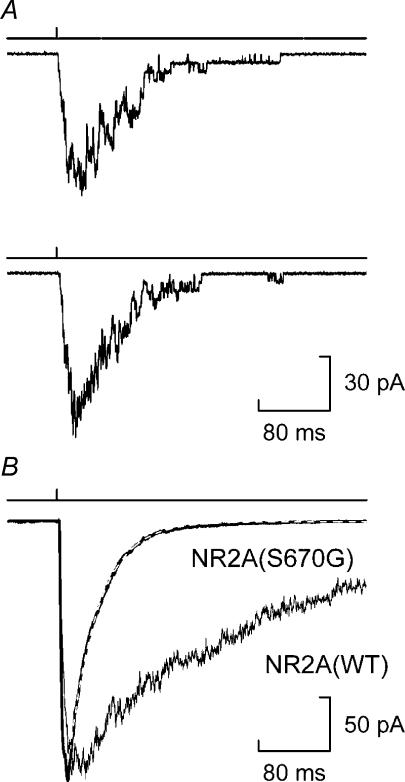
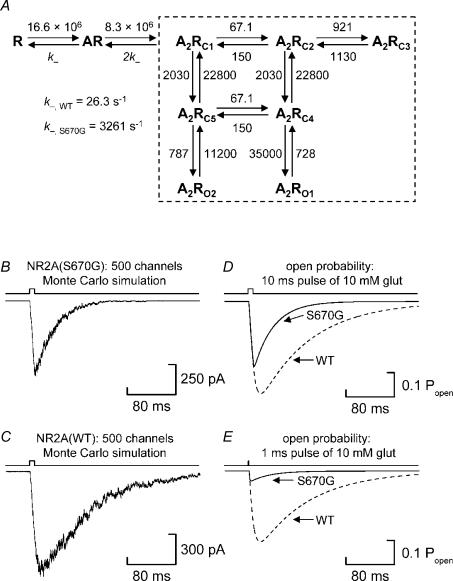
We have examined the function of a conserved serine residue (Ser670) in the S2 ligand-binding region of the NR2A N-methyl-d-aspartate (NMDA) receptor subunit, using recombinant NR1/NR2A receptors expressed in Xenopus laevis oocytes. Mutation of Ser670 to glycine (S670G) in NR2A reduced the potency of glutamate by 124-fold. Single-channel conductance and the duration of apparent open periods of NR2A(S670G) receptor mutants were, however, indistinguishable from wild-type NMDA receptors. NR1/NR2A(S670G) shut-time distributions were best described by a mixture of six exponential components, and the four shortest shut intervals of each distribution were considered to occur within a channel activation (burst). Bursts of single-channel openings were fitted with a mixture of four exponential components. The longest two components carried the majority of the charge transfer and had mean durations of 9.6 +/- 0.5 and 29.6 +/- 1.5 ms. The overall channel open probability during a burst was high (mean, 0.83 +/- 0.06). Consistent with a shortening of NMDA receptor-channel burst lengths was the observation of an increased deactivation rate of macroscopic currents evoked by brief applications of glutamate to outside-out membrane patches. Correlations between shut times and adjacent open times were observed in all data records. Noticeably, shorter than average openings tended to occur next to long closed periods, whereas longer than average openings tended to occur next to short closings. Our single-channel data, together with modelling using a kinetic scheme to describe channel activations, support our hypothesis that the S670G point mutation reduces the dwell time of glutamate in its binding site.


Figures

Figure 1
Figure 1. Location of Ser670 in the NR2A NMDA receptor subunit and the effect of the S670G mutation on glutamate potency
A, structure of the S1S2 ligand-binding pocket for the NR2A NMDA receptor subunit. The S1 and S2 binding domains form a hinged clamshell-like structure with the ligand-binding cavity nested between both regions. NR2A co-ordinates obtained from Furukawa et al. (2005; PDB accession code, 2A5S) and visualized using RasMol software. B, expanded view of the pocket with glutamate occupying its binding site. The residues Ser670 and Thr671, which are thought to form H-bonds with the γ-carboxyl group of the side-chain of glutamate, are illustrated. C, upper panel, linear representation of the structure of an NMDA receptor, showing the amino terminal domain (ATD), the two ligand-binding domains (S1 and S2), the four membrane-associated regions (M1–M4) and the carboxy terminal domain (CTD). Lower panel, partial amino acid alignments of the S2 domain of GluR2 AMPA receptors, the NR1 glycine-binding subunit and the four NR2 (A–D) glutamate-binding subunits. The conserved Ser and Thr residues in each of the subunits that bind glutamate are illustrated. D, glutamate concentration–response curves obtained from two-electrode voltage-clamp (TEVC) recordings obtained from oocytes expressing either NR2A(WT) (▪) or NR2A(S670G) NMDA receptor-channels (•) (n = 16 for each construct).
Figure 2
Figure 2. Single-channel amplitudes and open periods of NR1/NR2A(S670G) NMDA receptor-channels
A, examples of single-channel currents evoked by 100 μm glutamate (plus 20 μm glycine) and recorded from an outside-out membrane patch excised from an oocyte expressing NR1/NR2A(S670G) NMDA receptors. Patch potential was –100 mV. B, amplitude stability plot showing the individual amplitudes of events (with durations greater than 415 μs). The dashed lines indicate the mean values of the two Gaussian components shown in C. C, amplitude histogram of data shown in B. The distribution is fitted with a mixture of two Gaussian components with means and relative areas as indicated. D, open period distribution fitted with a mixture of three exponential components with means and relative areas as indicated. The distribution contains 4899 events and the fit predicts 5218 events and has an overall mean of 2.12 ms.
Figure 3
Figure 3. Steady-state NR1/NR2A(WT) and NR1/NR2A(S670G) NMDA receptor activity evoked by low concentrations of glutamate
A, example of a continuous (20 s in duration) single-channel recording obtained from an outside-out membrane patch excised from an oocyte expressing NR2A(WT) NMDA receptor-channels. The patch was held at −100 mV, and channel activity was evoked by 100 nm glutamate (plus 20 μm glycine). B, continuous (20 s in duration) single-channel recording obtained from an outside-out membrane patch (−100 mV) excised from an oocyte expressing NR2A(S670G) NMDA receptor-channels. In this example, channel activity was elicited by 20 μm glutamate (plus 20 μm glycine).
Figure 4
Figure 4. Distribution of shut times and burst length properties of NR1/NR2A(S670G) NMDA receptors
A, example of a shut-time distribution obtained from a recording of NR1/NR2A(S670G) NMDA receptor-channel activity elicited by 100 μm glutamate (plus 20 μm glycine). The distribution is fitted with a mixture of six exponential components with means and relative areas as indicated. Four thousand nine hundred and eight events are included in the distribution, while the fit predicts 11998 events. The tcrit used to separate the fourth and fifth components of the distribution was 12.5 ms. B, burst length distribution for data shown in A and in Fig. 2D. The distribution is fitted with a mixture of four exponential components with means and relative areas as indicated. One thousand four hundred and fifty-seven events are included in the distribution, while the fit predicts 1569 events. The dashed line shows the fit of the equivalent overall mean distribution for NR1/NR2A(WT) NMDA receptors (as reported by Wyllie et al. 1998). C, distribution of total open time per burst for data shown in B. The distribution is fitted with a mixture of four exponential components and contains 1457 events (1564 events are predicted). Again the dashed line shows the fit of the equivalent overall mean distribution for NR1/NR2A(WT) NMDA receptors (as reported by Wyllie et al. 1998).
Figure 5
Figure 5. Correlations between open periods and shut times
A, pooled data showing the correlation between mean open periods and adjacent shut-time intervals for events recorded from outside-out patches (n = 10) excised from oocytes expressing NR1/NR2A(WT) NMDA receptors. The dashed line indicates the overall mean open period for all events. Longer than average open periods occur adjacent to brief shut-time intervals, whereas shorter than average open periods occur adjacent to long shut-time intervals. B, pooled data showing correlations between open and shut times for NR2A(S670G)-containing NMDA receptors (n = 6). C, as B, but for NR2A(T671A)-containing NMDA receptors (n = 15).
Figure 6
Figure 6. NR1/NR2A(S670G) NMDA receptor-mediated currents evoked by brief applications of glutamate
A, examples of two macroscopic currents recorded from an outside-out patch excised from an oocyte expressing NR1/NR2A(S670G) NMDA receptors. Currents were evoked by exposing the patch to glutamate (10 mm) for a duration of 10 ms. B, average of 30 such sweeps as shown in A fitted with a single exponential decay component (dashed white line). Superimposed on the NR2A(S670G) trace is an example of a mean macroscopic current recorded from a patch containing NR1/NR2A(WT) NMDA receptors to highlight the difference in the decay kinetics of the two receptor types.
Figure 7
Figure 7. Simulating the effect of the NR2A(S670G) mutation by increasing the dissociation rate constant for glutamate
A, kinetic scheme described by Schorge et al. (2005) to account for single-channel activations of NR1/NR2A NMDA receptors expressed in Xenopus laevis oocytes. The rate constants indicated are those proposed by Schorge et al. (2005) and are given in units of m−1 s−1 or s−1, as appropriate. In the scheme, R denotes the unliganded receptor and AR the mono-liganded receptor. There are five doubly liganded shut states (denoted A2RC1–C5) and two open states (denoted A2RO1 and A2RO2). The dashed box indicates the reactions which occur independently of binding and which, for our purposes, we have assumed to be unaltered by the S670G mutation. For our simulations of NR1/NR2A(S670G) NMDA receptor activations, we multiplied the value of the dissociation rate constant for wild-type receptors by a factor of 124. Note that we have omitted from the kinetic scheme reaction rates describing glycine binding (and unbinding) because, under our recording conditions, we assume that the glycine binding site on the NR1 subunit was fully occupied. B, Monte Carlo simulation of a macroscopic current response generated from the kinetic scheme described in A using the rate constants shown with the microscopic dissociation rate constant for glutamate set to 3261 s−1. The simulated response was generated from a population of 500 receptors exposed to glutamate (10 mm) for 10 ms. C, Monte Carlo simulation of the activation of 500 channels using the rate constants as described for NR1/NR2A(WT) NMDA receptors by Schorge et al. (2005). D, comparison of the time course and magnitude (in terms of Popen(glut, 10 ms)) of NR1/NR2A(S670G) (continuous line; maximum Popen(glut, 10 ms) = 0.267) and NR1/NR2A(WT) responses (dashed line; maximum Popen(glut, 10 ms) = 0.38) obtained from numerical integration (4th order Runga Kutta). Fitting the decays of these simulated responses with a single exponential gives τdecay values of 41 ms for NR1/NR2A(S670G) responses and 109 ms for NR1/NR2A(WT) responses. E, comparison of the time course and magnitude (in terms of Popen(glut, 10 ms)) of NR1/NR2A(S670G) (continuous line) and NR1/NR2A(WT) responses (dashed line) obtained when the duration of the glutamate pulse is reduced to 1 ms. In this case, the maximum Popen is reduced for both NR1/NR2A(S670G) and NR1/NR2A(WT) NMDA receptors to 0.041 and 0.293, respectively.

Comment in

References

    1. Anson LC, Chen PE, Wyllie DJA, Colquhoun D, Schoepfer R. Identification of amino acid residues of the NR2A subunit that control glutamate potency in recombinant NR1/NR2A NMDA receptors. J Neurosci. 1998;18:581–589. - PMC - PubMed
    1. Anson LC, Schoepfer R, Colquhoun D, Wyllie DJA. Single-channel analysis of an NMDA receptor possessing a mutation in the region of the glutamate binding site. J Physiol. 2000;527:225–237. - PMC - PubMed
    1. Beato M, Groot-Kormelink PJ, Colquhoun D, Sivilotti LG. Openings of the rat recombinant alpha 1 homomeric glycine receptor as a function of the number of agonist molecules bound. J Gen Physiol. 2002;119:443–466. - PMC - PubMed
    1. Beato M, Groot-Kormelink PJ, Colquhoun D, Sivilotti LG. The activation mechanism of alpha1 homomeric glycine receptors. J Neurosci. 2004;24:895–906. - PMC - PubMed
    1. Chen PE, Geballe MT, Stansfeld PJ, Johnston AR, Yuan H, Jacob AL, Snyder JP, Traynelis SF, Wyllie DJA. Structural features of the glutamate binding site in recombinant NR1/NR2A N-methyl-d-aspartate receptors determined by site-directed mutagenesis and molecular modeling. Mol Pharmacol. 2005;67:1470–1484. - PubMed

Publication types

MeSH terms

LinkOut - more resources