. 2006 Aug 1;574(Pt 3):731-50.
doi: 10.1113/jphysiol.2006.110320. Epub 2006 May 18.

'Simplification' of responses of complex cells in cat striate cortex: suppressive surrounds and 'feedback' inactivation

Affiliations

'Simplification' of responses of complex cells in cat striate cortex: suppressive surrounds and 'feedback' inactivation

Cedric Bardy et al. J Physiol. .

Abstract

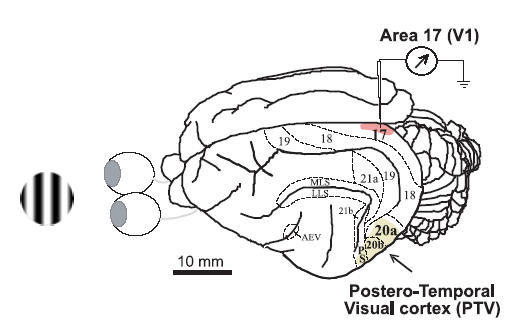
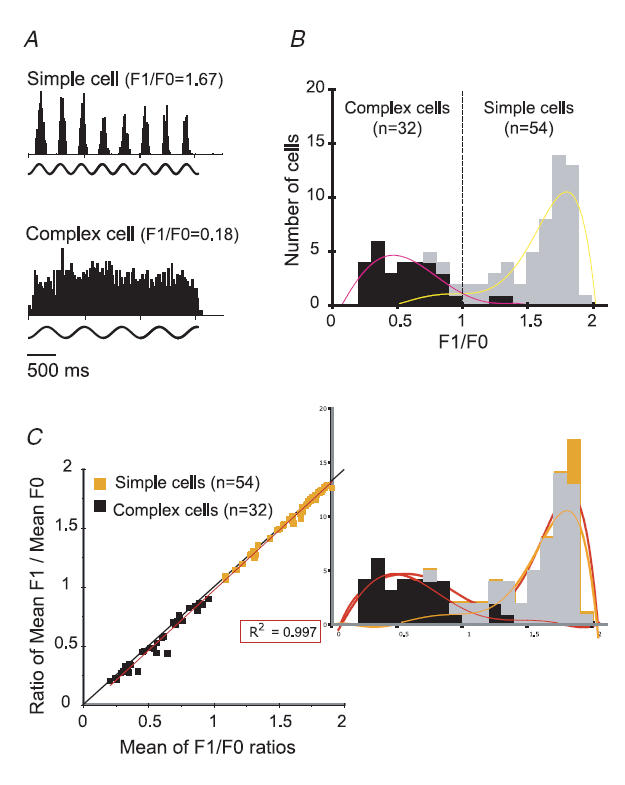
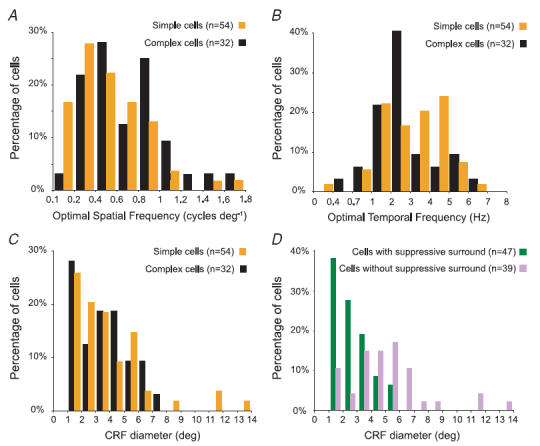
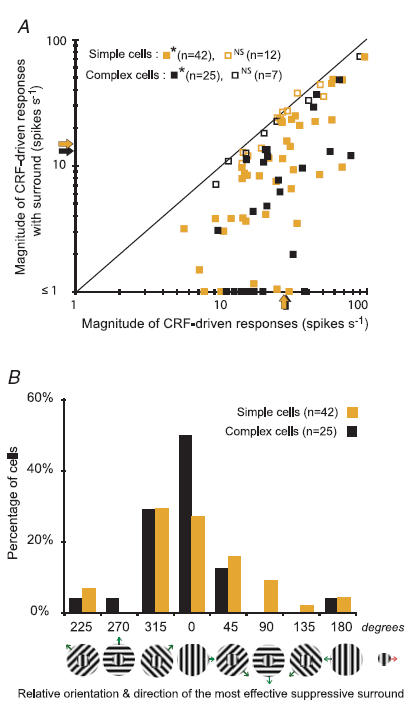
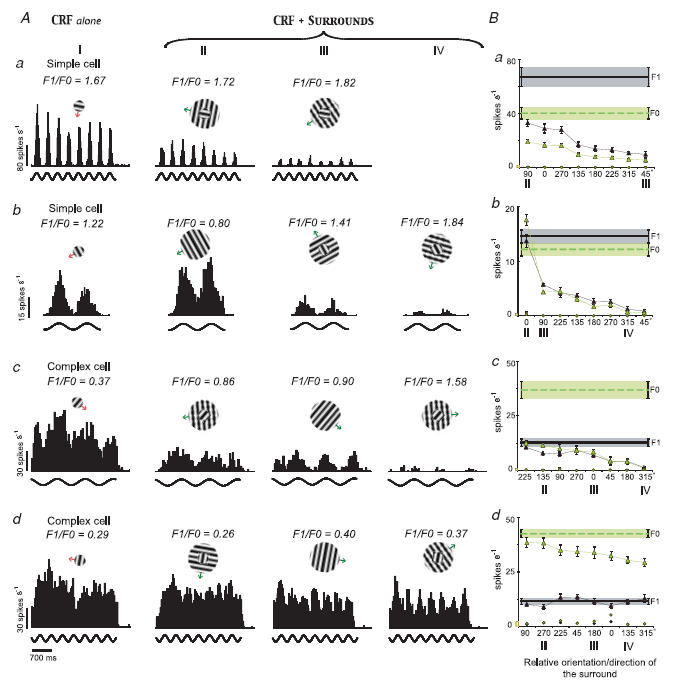
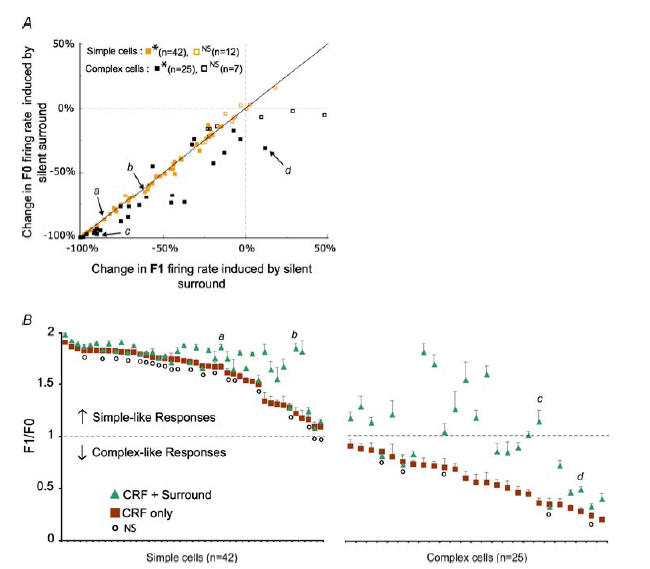
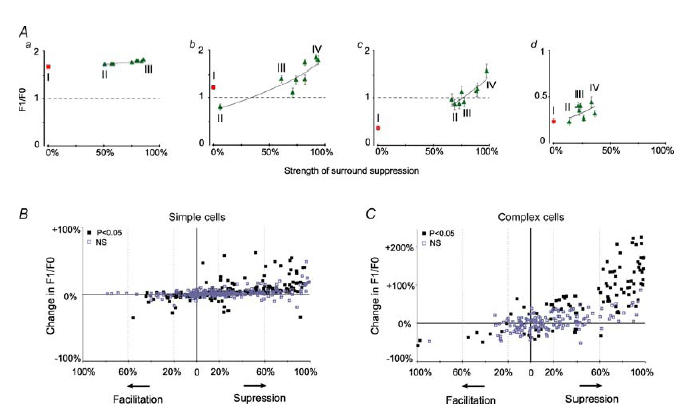
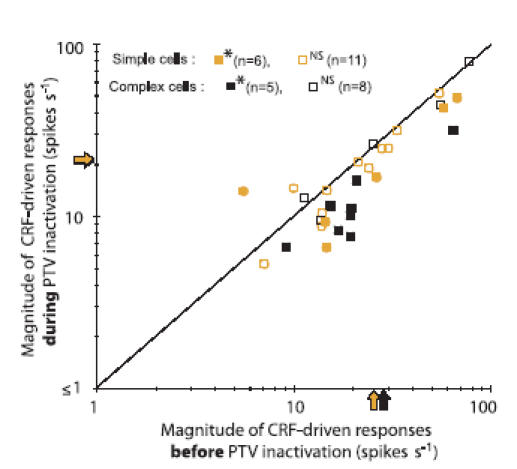
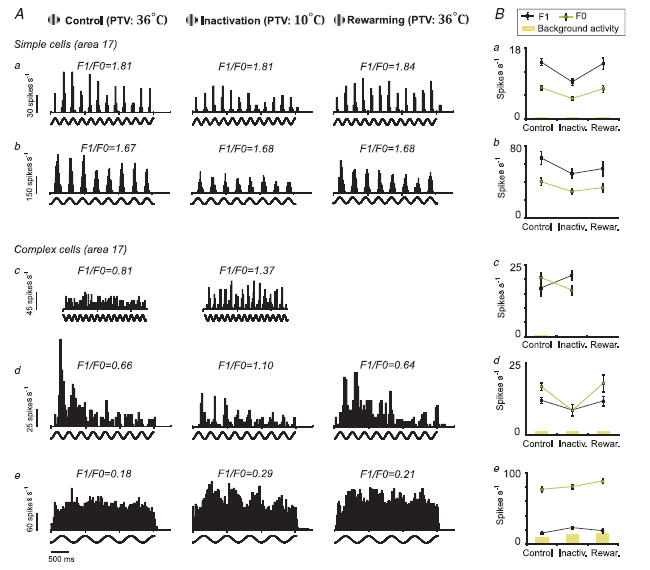
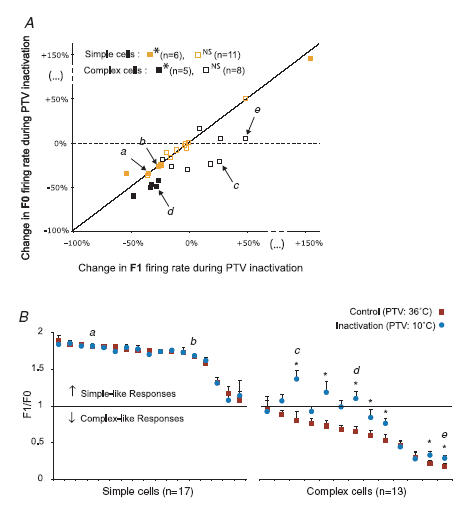
In mammalian striate cortex (V1), two distinct functional classes of neurones, the so-called simple and complex cells, are routinely distinguished. They can be quantitatively differentiated from each other on the basis of the ratio between the phase-variant (F1) component and the mean firing rate (F0) of spike responses to luminance-modulated sinusoidal gratings (simple, F1/F0 > 1; complex, F1/F0 < 1). We investigated how recurrent cortico-cortical connections affect the spatial phase-variance of responses of V1 cells in the cat. F1/F0 ratios of the responses to optimally oriented drifting sine-wave gratings covering the classical receptive field (CRF) of single V1 cells were compared to those of: (1) responses to gratings covering the CRFs combined with gratings of different orientations presented to the 'silent' surrounds; and (2) responses to CRF stimulation during reversible inactivation of postero-temporal visual (PTV) cortex. For complex cells, the relative strength of the silent surround suppression on CRF-driven responses was positively correlated with the extent of increases in F1/F0 ratios. Inactivation of PTV cortex increased F1/F0 ratios of CRF-driven responses of complex cells only. Overall, activation of suppressive surrounds or inactivation of PTV 'converted' substantial proportions (50 and 30%, respectively) of complex cells into simple-like cells (F1/F0 > 1). Thus, the simple-complex distinction depends, at least partly, on information coming from the silent surrounds and/or feedback from 'higher-order' cortices. These results support the idea that simple and complex cells belong to the same basic cortical circuit and the spatial phase-variance of their responses depends on the relative strength of different synaptic inputs.


Figures

Figure 1
Figure 1. Location of recording sites and cortical inactivation site
On the left is an example of a patch of sine-wave luminance-modulated drifting grating used as a visual stimulus. On the right is a dorsolateral view of the left cerebral hemisphere of the cat showing the locations of visual cortical areas. The locations of cytoarchitectonic and functional areas 17, 18, 19, 21a, 21b, 20a and 20b, as well as those of the anterior ectosylvian visual area (AEV), posterior suprasylvian area (PS) and several areas in the medial lateral suprasylvian (MLS) region and the lateral lateral suprasylvian (LLS) region are indicated (after Burke et al. 1998). The shaded part of area 17 (striate cortex, area V1) indicates the general location of all our electrode penetrations. The area labelled as ‘Postero-Temporal Visual cortex (PTV)’ represents the cortical surface that was in contact with the cooling probe.
Figure 2
Figure 2. Identification of simple and complex cells
A, PSTHs of responses of a typical simple (upper PSTH) and a complex cell (lower PSTH) in area V1. The action potentials of the cells were generated in response to the presentation of optimized gratings covering their CRFs. The sinusoidal lines below each PSTH represent the temporal frequency modulation of the visual stimulus energy. The PSTH of the simple cell (F1/F0 = 1.65 ± 0.02, mean ±s.e.m.) and that of the complex cell (F1/F0 = 0.18 ± 0.03) are based on the accumulation of 8 trials. The optimal spatial and temporal frequencies and optimal orientation were: 1 cycle deg−1, 2.7 Hz and 169 deg for the simple cell and 0.5 cycles deg−1, 1.5 Hz and 79 deg for the complex cell. B, frequency histogram of F1/F0 ratios for our sample of V1 neurones. The cells were qualitatively identified as simple (shaded columns) or complex (filled columns) on the basis of the presence or absence, respectively, of spatially separated light ‘on’ and light ‘off’ discharge subregions in their CRFs. The polynomial trend-lines illustrate the overall links between qualitatively identified complex cells and lower F1/F0 ratios (left curve) and between qualitatively identified simple cells and higher F1/F0 ratios (right curve). C, F1/F0 ratios calculated by averaging F1/F0 ratios for each cell in response to each stimulus presentation versus the F1/F0 ratios calculated from the same cell's mean F1/mean F0 for all trials. The linear trend-line calculated for the entire sample (r2= 0.997) corresponded closely to the diagonal axis.
Figure 3
Figure 3. Frequency histograms of optimal parameters for CRF stimuli in the present sample of area 17 cells
A, frequency histograms of optimal spatial frequencies for the present sample of area 17 cells. The median (0.5 cycles deg−1) and the mean optimal spatial frequencies (0.5 ± 0.3 cycles deg−1) for the simple cells were slightly lower than those (median, 0.6 cylces deg−1; mean, 0.7 ± 0.4 cycles deg−1) for the complex cells. B, frequency histograms of optimal temporal frequencies for the present sample of area 17 cells. Both the median (3.5 Hz) and the mean optimal temporal frequencies (3.5 ± 1.5 Hz) for the simple cells were higher than those (median, 2.5 Hz; mean, 3 ± 1.6 Hz) for the complex cells. C, frequency histogram of CRF sizes of simple and complex cells in the present sample. The median (4 deg) and the mean diameter (4.2 ± 2.7 deg) of the CRFs of simple cells were slightly larger than the median (3.8 deg) and the mean (3.9 ± 1.9 deg) of CRFs of complex cells. D, frequency histogram of CRF sizes of cells (both simple and complex) with or without significant suppressive surrounds when CRF + surround gratings of optimal orientation were used. The median (2.5 deg) and the mean diameter (2.9 ± 1.3 deg) of the CRFs of cells with suppresive surrounds were substantially smaller than the median (5 deg) and the mean diameter (5.5 ± 2.8 deg) of the CRF of complex cells.
Figure 4
Figure 4. Effects of stimulation of silent surround on the CRF-driven responses of neurones in area 17
A, the magnitudes of responses of each cell (F1 component for simple cells; F0 for complex cells) to optimized gratings restricted to their CRF versus the magnitudes of responses to co-stimulation of CRF and the silent surround. Except for orientations and directions which were varied, the parameters of the gratings presented in the surrounds were identical to those optimized for the CRFs. Here we illustrate only the effects of the surround configuration that maximally reduced the CRF-driven response. The shaded arrows indicate for simple cells the mean magnitude of the F1 component of CRF-driven responses (27.3 spikes s−1; s.e.m.± 2.5 spikes s−1) and that of CRF + surround responses (15.3 spikes s−1; s.e.m.± 2.1 spikes s−1). The black arrows indicate for complex cells the mean firing rate, F0, of CRF-driven responses (27.8 spikes s−1: s.e.m.± 3.5 spikes s−1) and that of CRF + surround responses (13.3 spikes s−1; s.e.m.± 2.9 spikes s−1). In the majority of cells the maximal reduction in the magnitude of responses induced by stimulation of the surrounds was significant (Mann–Whitney test, *P≤ 0.05 and non-significant (NS) for P > 0.05). In over 15% (9/54) of simple cells and in over 20% (7/32) of complex cells, stimulation of the surround suppressed the CRF-driven response to < 1 spike s−1. B, percentage frequency histogram of cells in which given orientations and directions of drifting of the surround gratings, relative to optimized orientation and direction of drifting of the CRF gratings, resulted in the greatest reduction in the response magnitude. The arrow attached to the icon on the right indicates the direction of the drift of the grating restricted to the CRFs. The arrows attached to the icons representing optimally oriented gratings restricted to the CRFs + gratings of different orientations presented in the surround indicate the directions of the drifts of the surround gratings.
Figure 5
Figure 5. Effects of stimulation of silent surrounds on the firing patterns of simple and complex cells in area 17
A, column I illustrates the PSTHs of 4 cells (a, b, c and d) to stimulation of their CRFs alone. Cells whose responses are illustrated in a, c and d were recorded from layers 6, 2 and 4, respectively. Columns II, III and IV illustrate the PSTHs of the cells' responses to stimulation of the CRF + surround. Stimulus configurations are shown at the top of each PSTH. Note that the CRF + surround PSTHs are ordered from left to right according to the strength of the surround-induced reduction in the magnitude of responses. B, tuning plots of the mean phase-variant F1 (filled triangles) and the mean firing rate, F0 (open triangles), of responses of the same 4 cells as a function of the orientation/direction incongruity between the CRF and the surround stimuli. Continuous and dashed horizontal lines indicate, respectively, the magnitude of F1 and F0 when CRFs were stimulated alone with optimized gratings. Shaded areas and error bars are the s.e.m. The filled and open circles indicate, respectively, the magnitudes of F1 component and F0 when the surrounds were stimulated alone. Bars on the abscissas next to 0 indicate the level of the background (‘spontaneous’) activity.
Figure 6
Figure 6. Effects of stimulation of silent surround on F1 and F0 firing rates and F1/F0 ratios
A, plot of percentage changes in the magnitude of the F1 component of responses against the percentage changes in the magnitude of the F0 induced by activation of silent surrounds. For simple cells the significance of changes is calculated on the basis of changes in the magnitude of F1 components, while for complex cells the significance of changes is calculated on the basis of the changes in the magnitude of F0 components (Mann–Whitney test, *P < 0.05; non-significant, NS for P > 0.05). The letters a, b, c and d refer to the 4 examples illustrated in Fig. 5. B, the graph shows F1/F0 ratios for 67 cells in which at least one surround orientation evoked a significant (P < 0.05; Mann–Whitney test) reduction in the magnitude of responses. The F1/F0 ratios are not plotted for cases where the magnitude of response was reduced by surround stimulation to less than 1 spike s−1 and/or by more than 90%. The squares indicate the mean F1/F0 ratios (±s.e.m.) of responses to CRF stimuli alone, while the triangles indicate F1/F0 ratios of responses for the combination of CRF + surround that showed the maximum reduction in the magnitude of responses. The small circles indicate the cells without significant changes (NS) to the F1/F0 ratios of responses to CRF stimulation versus CRF + surround stimulation (P > 0.05; Wilcoxon test). Again, the letters a, b, c and d refer to the 4 examples illustrated in Fig. 5.
Figure 7
Figure 7. Relationship between the strength of suppression and charges in F1/F0 ratios
A, graphs showing the F1/F0 ratios in relation to the strength of the surround-induced ‘suppression’ of the responses of 4 example cells (a, b, c and d) whose PSTHs are illustrated in Fig. 5. The F1/F0 ratios of responses to stimulation of CRFs alone are indicated by the squares while the F1/F0 ratios of responses to co-stimulation of CRFs + surrounds are indicated by triangles. B and C, relationship between the relative strengths of silent surround and percentage changes in the F1/F0 ratios induced by co-stimulation of CRFs and silent surrounds. Each point on the graphs indicates changes induced by one of 8 combinations of CRF + surround in each of 86 cells. The significance of the changes between the F1/F0 ratios of the responses to the stimulation of CRF alone and the F1/F0 ratios of responses to co-stimulation of CRF + surround was determined with the Wilcoxon test.
Figure 8
Figure 8. Effects of inactivation of PTV cortex on the magnitude of responses of V1 neurones to optimized sine-wave gratings restricted to the CRFs
The magnitudes of responses (F1 for simple cells, F0 for complex cells) before inactivation of PTV cortex (PTV kept at 36°C) are plotted against the corresponding magnitudes of responses during inactivation of PTV cortex (temperature of PTV lowered to 10°C). The shaded and black arrows on the axes indicate, respectively, the mean F1 for simple and mean F0 for complex cells. Significance of changes between the two states was determined with Mann–Whitney test (*P < 0.05 and NS for P > 0.05).
Figure 9
Figure 9. Effects of PTV cortex inactivation on the firing pattern of area 17 neurones
A, PSTHs of responses of 5 V1 cells stimulated with optimized gratings restricted to their CRF. Responses were recorded during three different states: PTV cortex kept at 36°C (left column, control); PTV cortex inactivated by cooling it to 10°C (middle column, inactivation); and within an hour after rewarming of PTV cortex to 36°C (right column, rewarming). Each PSTH represents an average of 8 trials. Due to deterioration of responses 10 min after rewarming, the ‘postrewarming’ PSTH of cell c is not presented. Cells a, b, d and e were recorded from layers 4, 6, 3 and 6, respectively. B, the mean F1 and F0 of the same 5 cells during control conditions, inactivation and after rewarming of PTV cortex. Error bars are s.e.m.
Figure 10
Figure 10. Effects of inactivation of PTV cortex on F1 and F0 firing rates and F1/F0 ratios
A, percentage changes in the magnitude of phase-variant F1 components induced by reversible PTV inactivation versus the percentage changes in the mean firing rates, F0. The letters a, b, c, d and e refer to the 5 examples illustrated in Fig. 9. The significance of changes was determined with the Mann–Whitney test (*P≤ 0.05 and NS for P > 0.05). B, graph illustrating the F1/F0 ratios of area 17 cells tested before and during inactivation of PTV cortex. The squares and corresponding circles indicate, respectively, the mean ratio F1/F0 ±s.e.m. of the responses before and those during inactivation of PTV cortex. Again, the letters a, b, c, d and e refer to the 5 examples illustrated in Fig. 9. The asterisks indicate cells with significant changes in the F1/F0 ratios during inactivation of PTV cortex (P < 0.05; Wilcoxon test).

References

    1. Akasaki T, Sato H, Yoshimura Y, Ozeki H, Shimegi S. Suppressive effects of receptive field surround on neuronal activity in the cat primary visual cortex. Neurosci Res. 2002;43:207–220. - PubMed
    1. Anderson JS, Lampl I, Gillespie DC, Ferster D. Membrane potential and conductance changes underlying length tuning of cells in cat primary visual cortex. J Neurosci. 2001;21:2104–2112. - PMC - PubMed
    1. Bair W. Visual receptive field organization. Curr Opin Neurobiol. 2005;15:1–6. - PubMed
    1. Bardy C, Huang JY, FitzGibbon T, Wang C, Dreher B. Suppressive surrounds ‘simplify’ complex cells in cat's primary visual cortex. Proc Austral Neurosci Soc. 2006;17:39.
    1. Barlow HB, Blakemore C, Pettigrew JD. The neural mechanism of binocular depth discrimination. J Physiol. 1967;193:327–342. - PMC - PubMed

Publication types

LinkOut - more resources