. 2006 Jul 15;574(Pt 2):519-33.
doi: 10.1113/jphysiol.2006.107227. Epub 2006 May 18.

T-tubule disorganization and reduced synchrony of Ca2+ release in murine cardiomyocytes following myocardial infarction

Affiliations

T-tubule disorganization and reduced synchrony of Ca2+ release in murine cardiomyocytes following myocardial infarction

William E Louch et al. J Physiol. .

Abstract

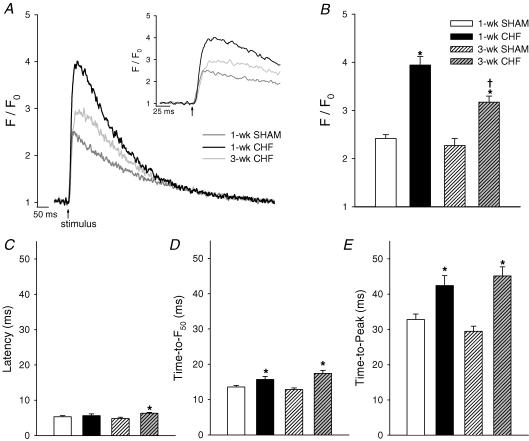
In cardiac myocytes, initiation of excitation-contraction coupling is highly localized near the T-tubule network. Myocytes with a dense T-tubule network exhibit rapid and homogeneous sarcoplasmic reticulum (SR) Ca(2+) release throughout the cell. We examined whether progressive changes in T-tubule organization and Ca(2+) release synchrony occur in a murine model of congestive heart failure (CHF). Myocardial infarction (MI) was induced by ligation of the left coronary artery, and CHF was diagnosed by echocardiography (left atrial diameter >2.0 mm). CHF mice were killed at 1 or 3 weeks following MI (1-week CHF, 3-week CHF) and cardiomyocytes were isolated from viable regions of the septum, excluding the MI border zone. Septal myocytes from SHAM-operated mice served as controls. T-tubules were visualized by confocal microscopy in cells stained with di-8-ANEPPS. SHAM cells exhibited a regular striated T-tubule pattern. However, 1-week CHF cells showed slightly disorganized T-tubule structure, and more profound disorganization occurred in 3-week CHF with irregular gaps between adjacent T-tubules. Line-scan images of Ca(2+) transients (fluo-4 AM, 1 Hz) showed that regions of delayed Ca(2+) release occurred at these gaps. Three-week CHF cells exhibited an increased number of delayed release regions, and increased overall dyssynchrony of Ca(2+) release. A common pattern of Ca(2+) release in 3-week CHF was maintained between consecutive transients, and was not altered by forskolin application. Thus, progressive T-tubule disorganization during CHF promotes dyssynchrony of SR Ca(2+) release which may contribute to the slowing of SR Ca(2+) release in this condition.


Figures

Figure 1
Figure 1. T-tubular structure is progressively disorganized during congestive heart failure (CHF) progression
T-tubules were visualized with 10 μm di-8-ANEPPS. Shown are confocal cross-sections of living cells, with greater detail shown in the smaller panels. In SHAM cells (A and C), T-tubules were organized in a regular striated pattern. In 1-week CHF (B), T-tubular structure appeared somewhat disorganized, while more pronounced disorganization was observed in 3-week CHF (D).
Figure 2
Figure 2. Three-week CHF myocytes exhibit increased dyssynchrony of Ca2+ transients
Longitudinal line scans in fluo-4-AM-loaded myocytes are displayed with the stimulus shown as a vertical line. A, Ca2+ release synchrony was quantified by thresholding images to half-maximal fluorescence (F50). The leading edge of the thresholded image was outlined to create a profile of the earliest time at which F50 was reached along the cell (A, far right). The standard deviation of these values was defined as the dyssynchrony index. B, Ca2+ release was quite uniform in most 1-week SHAM, 3-week SHAM, and 1-week CHF cells (see insets for greater detail of regions between arrowheads). More dyssynchronous Ca2+ release was observed in many 3-week CHF cells. C, mean dyssynchrony index values (1-week SHAM, ncells = 27; 1-week CHF, ncells = 24; 3-week SHAM, ncells = 25; 3-week CHF, ncells = 39; *P < 0.05 versus 3-week SHAM). D, distributions of dyssynchrony index measurements (Gaussian curve fits).
Figure 3
Figure 3. Three-week CHF cells show a greater number of delayed release regions
A, representative F50 profiles from a 3-week SHAM and 3-week CHF cell. Early Ca2+ release was defined for regions which reached F50 within 10 ms of the earliest F50 point (between dashed lines). Delayed release was defined outside this window, and delayed regions with a minimum width of 2 μm were considered (arrows). B, number of delayed release regions per cell (3-week SHAM, ncells = 22; 3-week CHF, ncells = 25; *P < 0.05). C, distributions of width measurements for delayed release regions (3-week SHAM, nregions = 26 in 22 cells; 3-week CHF, nregions = 73 in 25 cells).
Figure 4
Figure 4. Regions of delayed Ca2+ release occur at irregular gaps between T-tubules
T-tubules and Ca2+ transients were visualized simultaneously in fluo-4-AM-loaded myocytes stained with di-8-ANEPPS. Paired T-tubule and line-scan images are shown, with the position of the scan line indicated by a dotted vertical white line. In both 3-week SHAM (A) and 3-week CHF (B), Ca2+ release occurred early in regions near T-tubules, while delayed Ca2+ release regions always occurred at gaps between T-tubules. More gaps and delayed release regions were apparent in 3-week CHF than 3-week SHAM.
Figure 5
Figure 5. The general shape of F50 profiles is maintained between beats
F50 profiles are shown for five consecutive beats in a 3-week SHAM cell (A) and 3-week CHF cell (B). The extracted common signal for each set of profiles is indicated. C, the random beat-to-beat component of F50 profiles was more variable in 3-week CHF than 3-week SHAM, as indicated for beat 3 of the profiles in A and B. D, mean prediction error variance decreased in both 3-week CHF (ncells = 16) and 3-week SHAM (ncells = 16) as more replicates were included in the calculation. This decline closely followed theoretical values.
Figure 6
Figure 6. Ca2+ release is not synchronized by forskolin
In both 3-week SHAM and 3-week CHF cells, the general pattern of Ca2+ release was not altered by forskolin treatment.
Figure 7
Figure 7. Overall Ca2+ release becomes progressively slower during CHF
A, representative spatially averaged Ca2+ transients, with the early phase expanded in the inset. B, mean transient magnitudes were increased in CHF. Mean latency, time-to-F50, and time-to-peak values are shown in C, D, and E, respectively. Slowing of overall Ca2+ release in CHF occurred predominantly between F50 and peak fluorescence (1-week SHAM, ncells = 27; 1-week CHF, ncells = 24; 3-week SHAM, ncells = 25; 3-week CHF, ncells = 39; *P < 0.05 versus respective SHAM, †P < 0.05 versus 1-week CHF).
Figure 8
Figure 8. Alterations in local Ca2+ transients during CHF
A, representative local Ca2+ transients from early and delayed Ca2+ release regions are shown for a 3-week SHAM cell and 3-week CHF cell. B, mean time-to-F50 values; C, time-to-peak values. Transients in delayed regions exhibited broad peaks, with marked slowing between F50 and peak fluorescence (3-week SHAM, nearly regions = 27, nlate regions = 11, from 10 cells; 3-week CHF, nearly regions = 20, nlate regions = 20, from 10 cells; *P < 0.05 versus respective early region, †P < 0.05 versus equivalent region in SHAM).

Comment in

  • T-tubule trouble.
    Orchard C. Orchard C. J Physiol. 2006 Jul 15;574(Pt 2):330. doi: 10.1113/jphysiol.2006.113803. Epub 2006 May 25. J Physiol. 2006. PMID: 16728445 Free PMC article. No abstract available.

References

    1. Balijepalli RC, Lokuta AJ, Maertz NA, Buck JM, Haworth RA, Valdivia HH, Kamp TJ. Depletion of T-tubules and specific subcellular changes in sarcolemmal proteins in tachycardia-induced heart failure. Cardiovasc Res. 2003;59:67–77. - PubMed
    1. Berlin JR. Spatiotemporal changes of Ca2+ during electrically evoked contractions in atrial and ventricular cells. Am J Physiol. 1995;269:H1165–H1170. - PubMed
    1. Bers DM. Cardiac excitation-contraction coupling. Nature. 2002;415:198–205. - PubMed
    1. Beuckelmann DJ, Erdmann E. Ca2+-currents and intracellular [Ca2+]i-transients in single ventricular myocytes isolated from terminally failing human myocardium. Basic Res Cardiol. 1992;87(Suppl. 1):235–243. - PubMed
    1. Brette F, Rodriguez P, Komukai K, Colyer J, Orchard CH. Beta-adrenergic stimulation restores the Ca2+ transient of ventricular myocytes lacking T-tubules. J Mol Cell Cardiol. 2004;36:265–275. - PubMed

Publication types

MeSH terms