. 2006 May 19;312(5776):1054-9.
doi: 10.1126/science.1122088.

A systems approach to mapping DNA damage response pathways

Affiliations

A systems approach to mapping DNA damage response pathways

Christopher T Workman et al. Science. .

Abstract

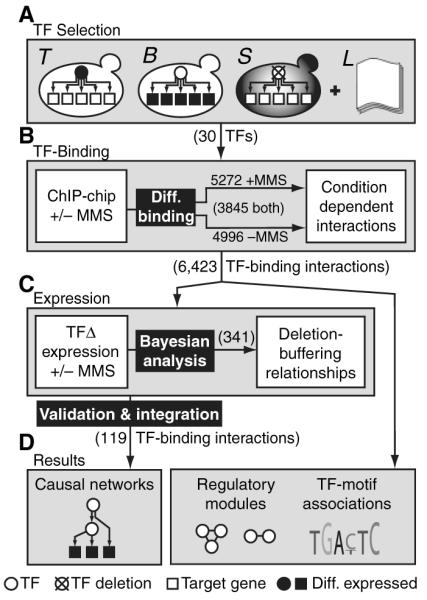
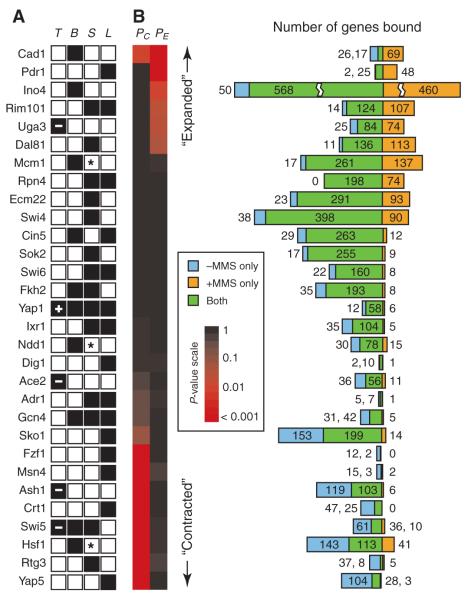
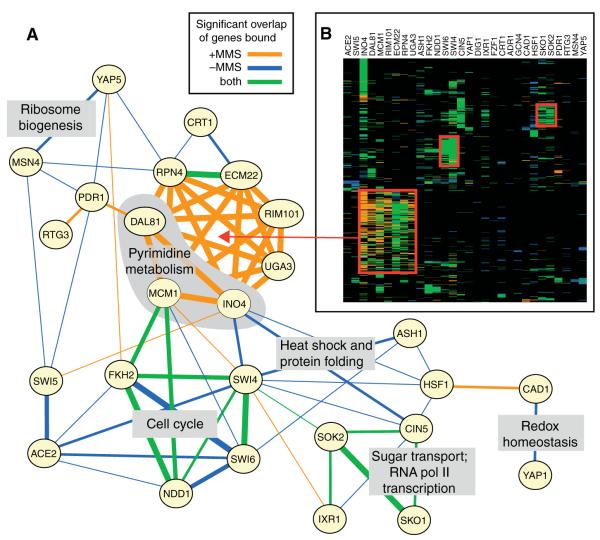
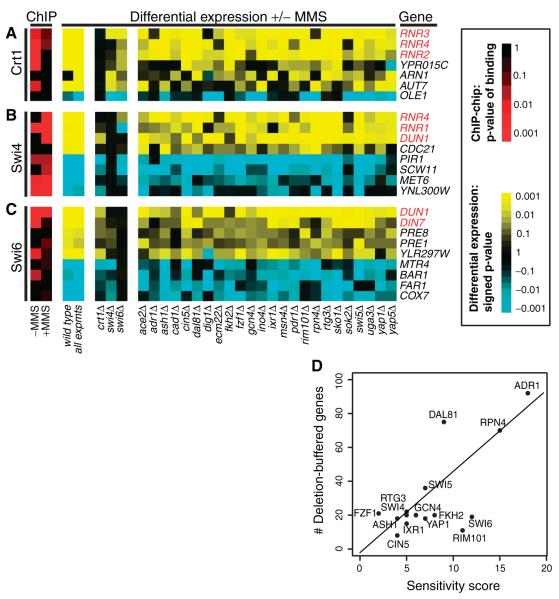
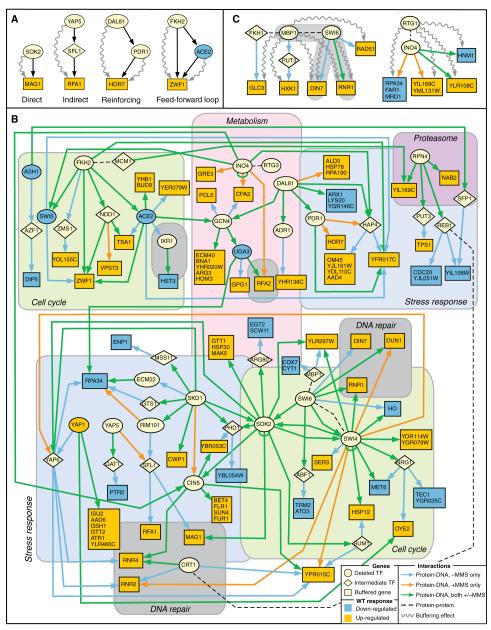
Failure of cells to respond to DNA damage is a primary event associated with mutagenesis and environmental toxicity. To map the transcriptional network controlling the damage response, we measured genomewide binding locations for 30 damage-related transcription factors (TFs) after exposure of yeast to methyl-methanesulfonate (MMS). The resulting 5272 TF-target interactions revealed extensive changes in the pattern of promoter binding and identified damage-specific binding motifs. As systematic functional validation, we identified interactions for which the target changed expression in wild-type cells in response to MMS but was nonresponsive in cells lacking the TF. Validated interactions were assembled into causal pathway models that provide global hypotheses of how signaling, transcription, and phenotype are integrated after damage.


Figures

Fig. 1
Fig. 1
Overview of the systems approach (see text).
Fig. 2
Fig. 2
TF selection and ChIP-chip experiments. (A) Results of the four criteria used to select the 30 TFs [TF (T) expression, expression of bound (B) genes, sensitivity (S), or literature (L); see text]. In column T, a “+” or “−” represents increased or decreased expression, respectively. For column S, a “*” denotes essential TFs. (B) Number of gene promoters bound by each TF. The three regions represent promoters bound exclusively in the absence of MMS (blue), presence of MMS (orange), or in both conditions (green). The proportion of genes in each region was compared to a negative control data set using Fisher’s exact test (16). A red square in the left column (PC’, “Contracted”) indicates that the proportion absence/both is significantly higher than expected in the negative control. Similarly, red in the right column (PE’, “Expanded”) indicates that the proportion presence/both is higher.
Fig. 3
Fig. 3
Overlap in TF binding patterns in response to MMS. (A) TFs are linked if they bind sets of promoters that significantly overlap. Thicker lines represent overlap that is more statistically significant than overlap represented by thin lines. Linked TFs are labeled with the high-level functions of their associated sets of (co)-regulated genes. (B) Hierarchical clustering matrix for the 30 TFs (columns) across the top 1000 gene targets with highest variance (in log P-value of binding; rows) pooled over −MMS and +MMS conditions. Color is based on the binding condition(s), as in (A), or is black when the target is not bound in either condition.
Fig. 4
Fig. 4
Representative genes showing deletion buffering for (A) Crt1, (B) Swi4, or (C) Swi6. Expression changes are colored yellow for up-regulation or blue for down-regulation. Genes highlighted in red are those previously known to function in the DNA damage response. (D) Correlation between phenotypic sensitivity of each deletion strain in MMS (x axis) versus the number of genes buffered by the TF deletion (y axis). Sensitivity scores were drawn from (6). Scores range from 0 to 30, where high scores indicate that a TF deletion was found to be sensitive to low concentrations (less than 0.03%) of MMS over replicate growth experiments. Only TFs with detectable sensitivity (score > 0) are shown.
Fig. 5
Fig. 5
A network of regulatory interactions connecting TFs to deletion-buffered genes. (A) Example regulatory paths in which deletion-buffering effects (squiggled arrows) support binding interactions (straight arrows). (B) The full validated model based on overlap between binding and buffering (see text). Buffering effects are omitted for clarity (listed in table S8). Regions of the network are organized on the basis of known functions of the deleted TFs. (C) Models resulting from follow-up experiments to generate buffering profiles for Mbp1 and Rtg1.

References

    1. Friedberg EC, et al. DNA Repair and Mutagenesis. ed. 2 American Society for Microbiology; Washington, DC: 2005.
    1. Rouse J, Jackson SP. Science. 2002;297:547. - PubMed
    1. Gasch AP, et al. Mol. Biol. Cell. 2001;12:2987. - PMC - PubMed
    1. Jelinsky SA, Samson LD. Proc. Natl. Acad. Sci. U.S.A. 1999;96:1486. - PMC - PubMed
    1. Jelinsky SA, Estep P, Church GM, Samson LD. Mol. Cell. Biol. 2000;20:8157. - PMC - PubMed

Publication types