. 2006 Jun 21;25(12):2867-77.
doi: 10.1038/sj.emboj.7601156. Epub 2006 May 18.

NR2B tyrosine phosphorylation modulates fear learning as well as amygdaloid synaptic plasticity

Affiliations

NR2B tyrosine phosphorylation modulates fear learning as well as amygdaloid synaptic plasticity

Takanobu Nakazawa et al. EMBO J. .

Abstract

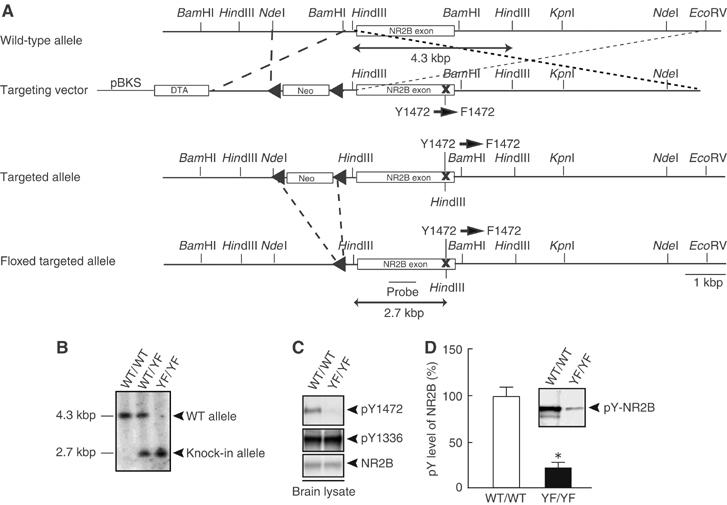
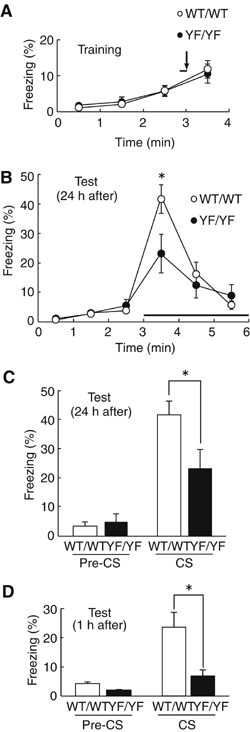
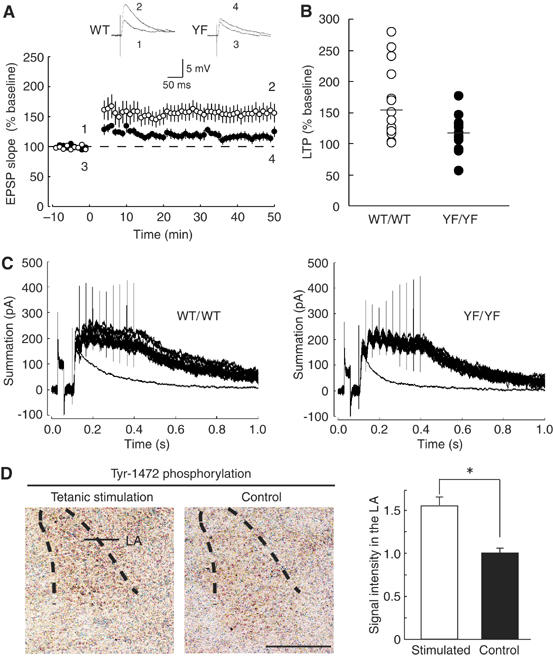
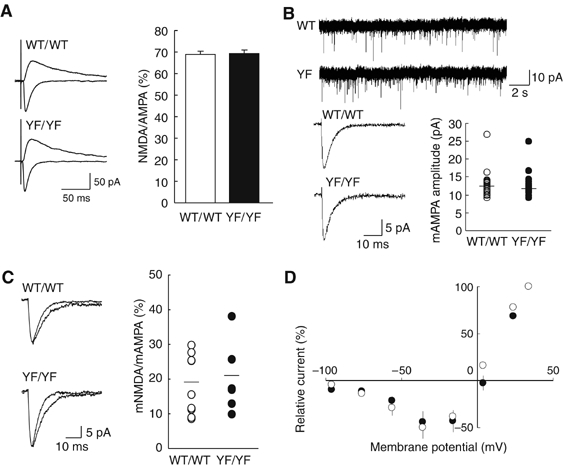
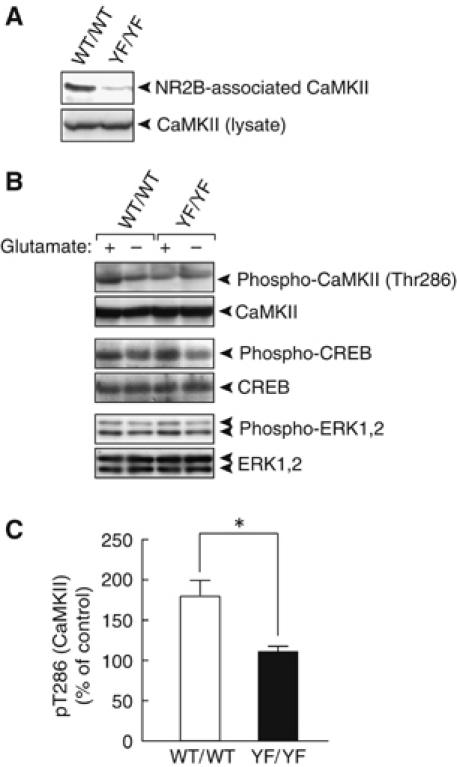
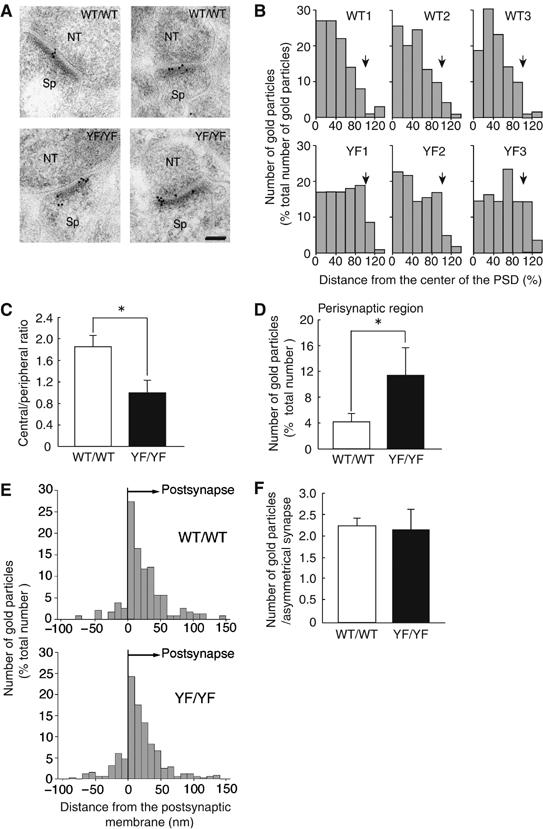
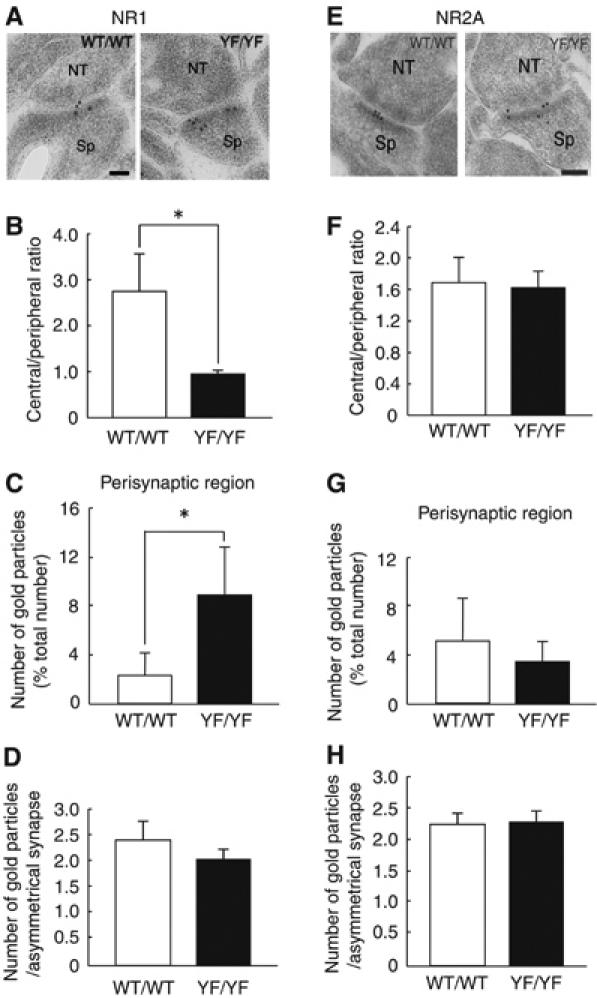
Phosphorylation of neural proteins in response to a diverse array of external stimuli is one of the main mechanisms underlying dynamic changes in neural circuitry. The NR2B subunit of the NMDA receptor is tyrosine-phosphorylated in the brain, with Tyr-1472 its major phosphorylation site. Here, we generate mice with a knockin mutation of the Tyr-1472 site to phenylalanine (Y1472F) and show that Tyr-1472 phosphorylation is essential for fear learning and amygdaloid synaptic plasticity. The knockin mice show impaired fear-related learning and reduced amygdaloid long-term potentiation. NMDA receptor-mediated CaMKII signaling is impaired in YF/YF mice. Electron microscopic analyses reveal that the Y1472F mutant of the NR2B subunit shows improper localization at synapses in the amygdala. We thus identify Tyr-1472 phosphorylation as a key mediator of fear learning and amygdaloid synaptic plasticity.


Figures

Figure 1
Figure 1
Generation of mice with a mutation of the NR2B tyrosine phosphorylation site. (A) Schematic representations of the structures of WT, targeting vector, and targeted and floxed-targeted NR2B alleles with relevant restriction sites. The probe for Southern blotting is indicated. pBKS, pBluescriptIIKS plasmid; DTA, diphtheria toxin gene; neo, neomycin-resistance gene. (B) The Southern blot analysis of HindIII-digested genomic DNAs from WT/WT, WT/YF and YF/YF mice. (C) The absence of Tyr-1472 phosphorylation in homozygous YF/YF mice (upper). Equal amounts of amygdaloid lysates from WT/WT and YF/YF mice were probed with the anti-pY1472 antibody. (D) A reduced level of NR2B tyrosine-phosphorylation in YF/YF mice. Equal amounts of NR2B immunoprecipitates from amygdaloid lysates of WT/WT and YF/YF mice were probed with the anti-pY (4G10) mAb. A representative blot is shown in the inset. All data are presented as the mean±s.e.m. (Figures 1, 2, 3, 4, 5, 6 and 7 and Supplementary Figures 1–7). *P<0.001, Student's t-test.
Figure 2
Figure 2
Impairment of auditory fear conditioning in YF/YF mice. (A) Freezing responses of WT/WT and YF/YF mice in auditory fear conditioning on the conditioning day (at 3 min; WT/WT, 5.88±1.43, n=17; YF/YF, 5.69±1.41, n=17; P>0.9, ANOVA). 170 s after mice were placed in the conditioning chamber, a tone was presented for 10 s (solid line); at the end of the tone mice were given a footshock (arrow). (B) Freezing responses 24 h after conditioning. At 3 min after mice were placed into a testing chamber with novel contexts, the tone was presented (solid line). WT/WT, n=17; YF/YF, n=17; *P< 0.03, ANOVA. (C, D) Summary of freezing responses 24 h after conditioning (C) and 1 h after conditioning (D). Freezing in the absence of the tone (Pre-CS) and in the presence of the tone (CS) was calculated as the mean freezing response from 2 to 3 min and from 3 to 4 min, respectively, after placement in the testing chamber. (24 h, *P< 0.03, ANOVA; 1 h, WT/WT, n=20; YF/YF, n=10; *P<0.04, ANOVA).
Figure 3
Figure 3
Impaired amygdaloid LTP in YF/YF mice. (A) The averaged time course of LTP in WT/WT (n=17) and YF/YF (n=16) mice. Maximal initial EPSP slopes were normalized in each experiment to the averaged maximal initial EPSP slope during the control period (−10 to 0 min). LTP was induced by ‘pairing' at time 0. Sample traces of EPSPs (average of 10 consecutive responses) in WT/WT and YF/YF mice recorded at the times indicated by the numbers are shown in the inset. (B) Summary of LTP (WT/WT, n=17; YF/YF, n=16; P<0.02, Student's t-test) expressed as percent of the mean EPSP slope from 40 to 50 min after the induction relative to the mean EPSP slope during the control period (−10 to 0 min). Horizontal bars indicate the means. (C) Sample traces showing the temporal summation of NMDAR-mediated EPSCs elicited by the same stimulation protocol used for the LTP induction. Fifteen traces evoked by 30-Hz stimulation at 10-s intervals and a single EPSC trace (average of 10 traces) are superimposed. (D) (left) The level of Tyr-1472 phosphorylation is increased after electrical stimulation in the LA. Coronal sections including the LA were stained with the anti-phospho-Tyr1472 antibody. La, lateral amygdala. (right) Quantification of Tyr-1472 phosphorylation in the LA. *P<0.004, Student's t-test, n=3. The calibration bar, 500 μm.
Figure 4
Figure 4
Normal basic properties of synaptic transmission in YF/YF mice. (A) Sample traces (average of 10 traces) of evoked AMPAR-mediated (downward traces) and NMDAR-mediated (upward traces) EPSCs in WT/WT and YF/YF mice (left). Ratio of amplitudes of NMDAR-mediated EPSCs to those of AMPAR-mediated EPSCs (right) (WT/WT mice, n=9; YF/YF mice, n=12). The ratio was calculated for each cell, and the values were then averaged for all cells. (B) Unaltered AMPAR-mediated mESPCs in YF/YF mice. Sample traces showing multiple events on a slower time scale (top). Averaged traces of mEPSCs recorded from single neurons (consecutive 100 events are averaged for WT/WT mice; consecutive 82 events for YF/YF mice) (bottom, left). Summary of the mean amplitude of AMPAR-mediated mEPSCs (bottom, right) in WT/WT (n=23) and YF/YF mice (n=20). Horizontal bars indicate the means. (C) Sample traces of AMPAR-mediated mEPSCs (faster traces) and AMPAR-plus NMDAR-mediated mEPSCs (slower traces) in WT/WT (average of 28 traces for AMPA and NMDA mEPSCs; average of 50 traces for AMPA mEPSCs) and YF/YF (average of 53 traces for both AMPA and NMDA mEPSCs and AMPA mEPSCs) mice (left). Ratio of the mean amplitude of NMDAR-mediated mEPSCs (AMPA mEPSCs were digitally subtracted from AMPA plus NMDA mEPSCs) to that of AMPAR-mediated mEPSCs (WT/WT, n=9; YF/YF, n=7). Horizontal bars indicate the means. (D) Current–voltage relationships of evoked NMDA synaptic currents recorded in the presence of 10 μM CNQX in WT/WT (n=5) and YF/YF (n=5) mice. The current values were normalized to the value at +34 mV in each cell, and the values were then averaged for all cells. The liquid junction potential was compensated.
Figure 5
Figure 5
Impaired NMDAR-mediated CaMKII signaling in YF/YF mice. (A) Interaction of CaMKII with the WT NR2B, but very little interaction with Y1472FNR2B. NR2B immunoprecipitates (top) and lysates (bottom) were probed with the anti-CaMKII mAb. (B) Impaired glutamate-induced upregulation of CaMKII in YF/YF mice. Stimulation of coronal sections including the LA with glutamate was performed as described in Materials and methods. (C) Quantification of phospho-CaMKII in WT/WT (n=6 from 3 mice) and YF/YF mice (n=6 from 3 mice). *P<0.01, Student's t-test.
Figure 6
Figure 6
Improper localization of the NR2B subunit in synaptic and perisynaptic regions in YF/YF mice. (A) Postembedding immunogold staining of NR2B subunits at asymmetrical axo-spinous synapses in the LA of WT/WT (WT/WT1 in B) and YF/YF (YF/YF1 in B) mice. NT, nerve terminal; Sp, spine. The calibration bar, 50 nm. (B–D) Tangential distribution of the NR2B subunit (WT/WT, 88 synapses; YF/YF, 102 synapses). (B) Histograms for the tangential distribution of NR2B subunits at synapses of WT/WT and YF/YF mice. Arrows indicate a boundary of the PSD. (C) Ratio of the number of immunogold particles for the NR2B subunit in the central region to that in the peripheral region. *P<0.01, Student's t-test. (D) The number of immunogold particles for the NR2B subunit in the perisynaptic regions. Results are expressed as percent of the total number of immunogold particles at synapses. *P<0.03, Student's t-test. (E) Histograms for the perpendicular distribution of NR2B subunits at synapses of WT/WT (66 synapses) and YF/YF mice (72 synapses). (F) The number of immunogold particles for the NR2B subunit per profile of synapses in the LA of the WT/WT (447 synapses) and YF/YF (451 synapses) mice. P>0.7, Student's t-test.
Figure 7
Figure 7
Improper localization of NR1 but normal localization of NR2A in synaptic and perisynaptic regions in YF/YF mice. (A) Postembedding immunogold staining of the NR1 subunit at asymmetrical axo-spinous synapses in the LA of WT/WT (WT/WT1 in Supplementary Figure 4A) and YF/YF (YF/YF1 in Supplementary Figure 4A) mice. NT, nerve terminal; Sp, spine. The calibration bar, 50 nm. (B, C) Tangential distribution of the NR1 subunit (WT/WT, 81 synapses; YF/YF, 84 synapses). (B) Ratio of the number of immunogold particles for the NR1 subunit in the central region to that in the peripheral region (WT/WT, 2.70±0.88; YF/YF, 0.79±0.14; *P<0.02, Student's t-test). (C) The number of immunogold particles for the NR1 subunit in the perisynaptic regions. Results are expressed as percent of the total number of immunogold particles at synapses (WT/WT, 2.27±1.63%; YF/YF, 8.47±3.89%; *P<0.03, Student's t-test). (D) The number of immunogold particles for the NR1 subunit per profile of synapses in the LA of WT/WT (2.45±0.43, 100 synapses) and YF/YF (2.07±0.20, 100 synapses; P>0.2, Student's t-test) mice. (E) Postembedding immunogold staining of the NR2A subunit at asymmetrical axo-spinous synapses in the LA of WT/WT (WT/WT1 in Supplementary Figure 4C) and YF/YF (YF/YF1 in Supplementary Figure 4C) mice. The calibration bar, 50 nm. (F, G) Tangential distribution of the NR2A subunit (WT/WT, 70 synapses; YF/YF, 55 synapses). (F) Ratio of the number of immunogold particles for the NR2A subunit in the central region to that in the peripheral region (WT/WT, 1.69±0.36; YF/YF, 1.59±0.25; P>0.7, Student's t-test). (G) The number of immunogold particles for the NR2A subunit in the perisynaptic regions (WT/WT, 5.38±3.15%; YF/YF, 3.55±1.51%; P>0.2, Student's t-test). (H) The number of immunogold particles for the NR2A subunit per profile of synapses in the LA of WT/WT (2.32±0.15, 70 synapses) and YF/YF (2.35±0.16, 55 synapses; P>0.7, Student's t-test) mice.

References

    1. Barria A, Malinow R (2005) NMDA receptor subunit composition controls synaptic plasticity by regulating binding to CaMKII. Neuron 48: 289–301 - PubMed
    1. Bauer EP, Schafe GE, LeDoux JE (2002) NMDA receptors and L-type voltage-gated calcium channels contribute to long-term potentiation and different components of fear memory formation in the lateral amygdala. J Neurosci 22: 5239–5249 - PMC - PubMed
    1. Bayer KU, Koninck PD, Leonard AS, Hell JW, Schulman H (2001) Interaction with the NMDA receptor locks CaMKII in an active conformation. Nature 411: 801–805 - PubMed
    1. Blanpied TA, Scott DB, Ehlers MD (2002) Dynamics and regulation of clathrin coats at specialized endocytic zones of dendrites and spines. Neuron 36: 435–449 - PubMed
    1. Bliss TVP, Collingridge GL (1993) A synaptic model of memory: long-term potentiation in the hippocampus. Nature 361: 31–39 - PubMed

Publication types

MeSH terms

Substances