. 2005 May;7(1):137-159.
doi: 10.1007/s10109-005-0154-7.

Detection of temporal changes in the spatial distribution of cancer rates using local Moran's I and geostatistically simulated spatial neutral models

Affiliations

Detection of temporal changes in the spatial distribution of cancer rates using local Moran's I and geostatistically simulated spatial neutral models

Pierre Goovaerts et al. J Geogr Syst. 2005 May.

Abstract

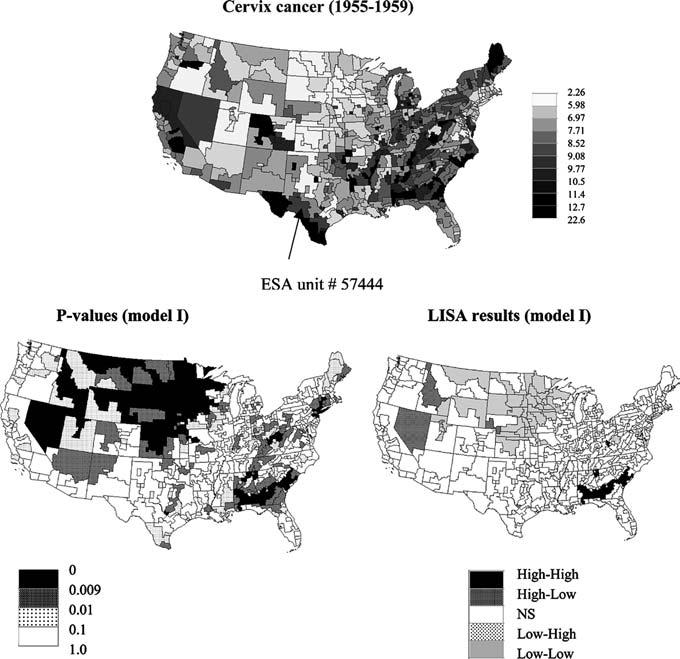
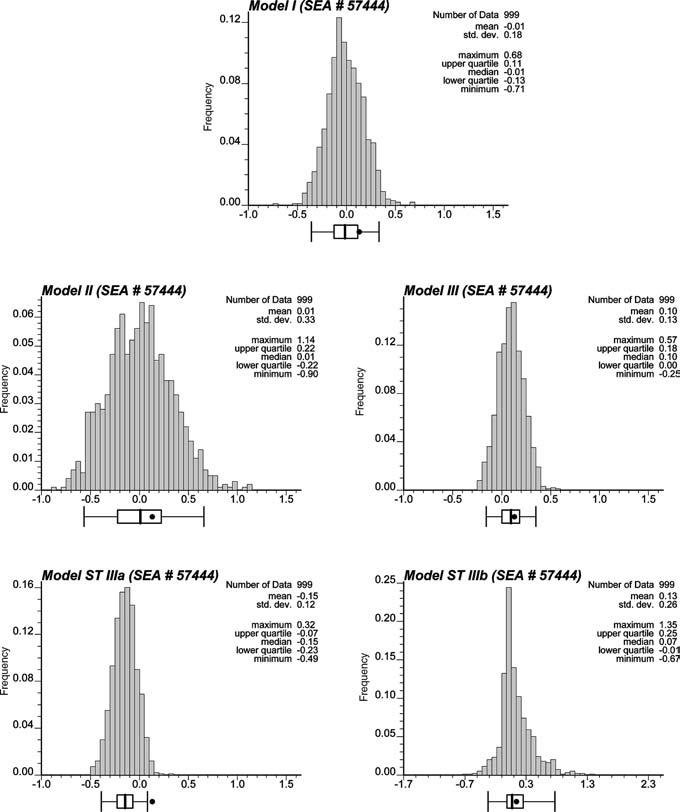
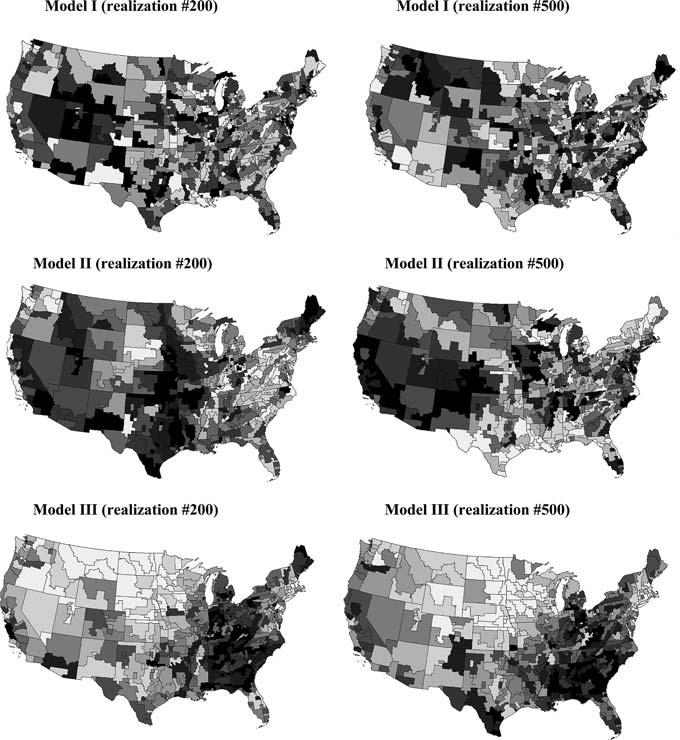
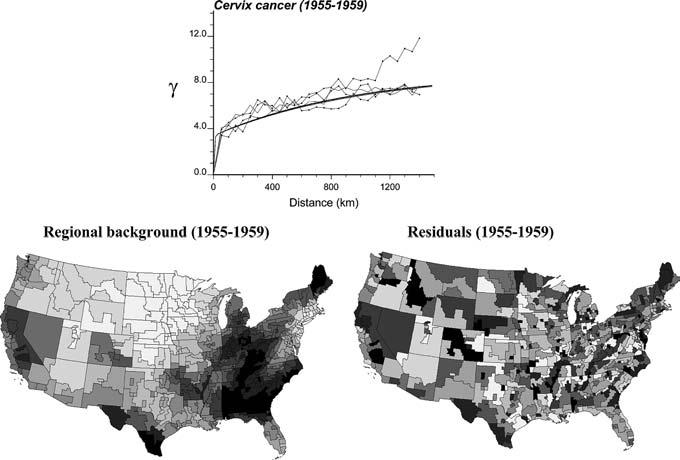
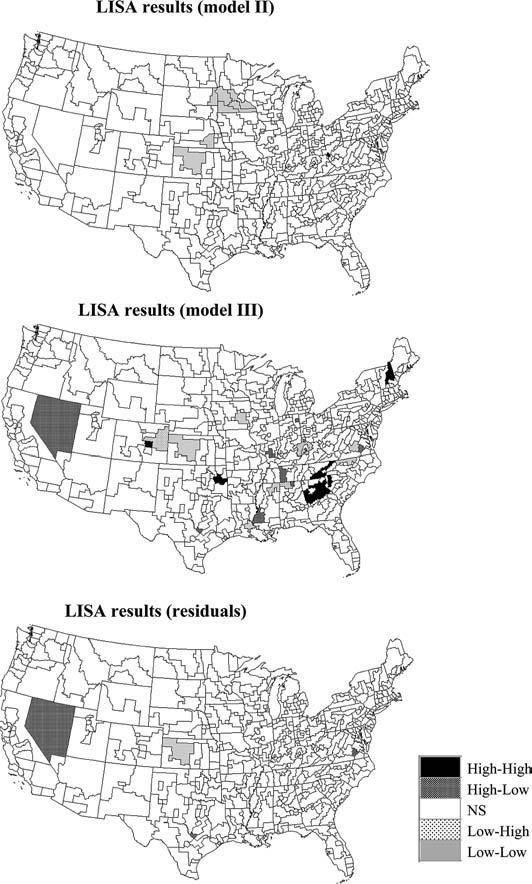
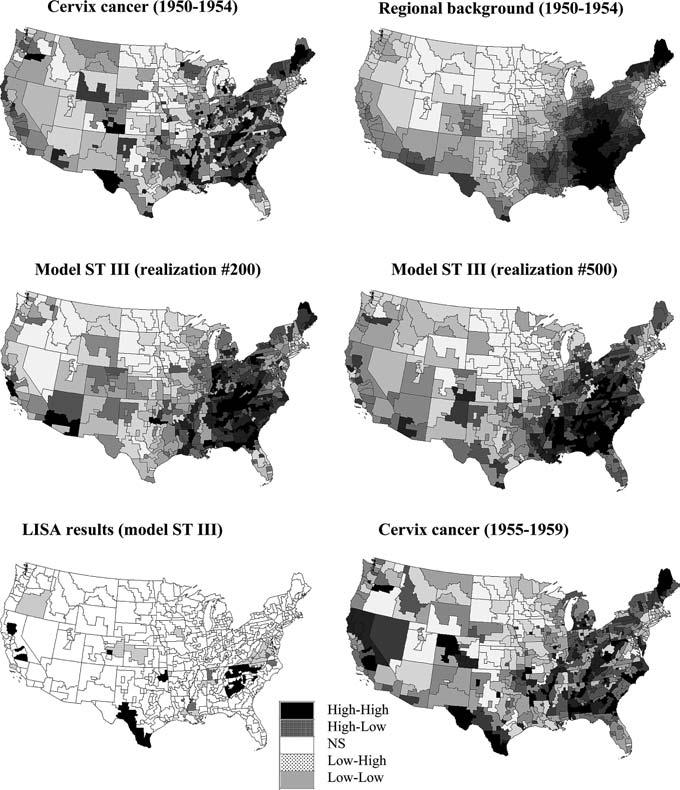
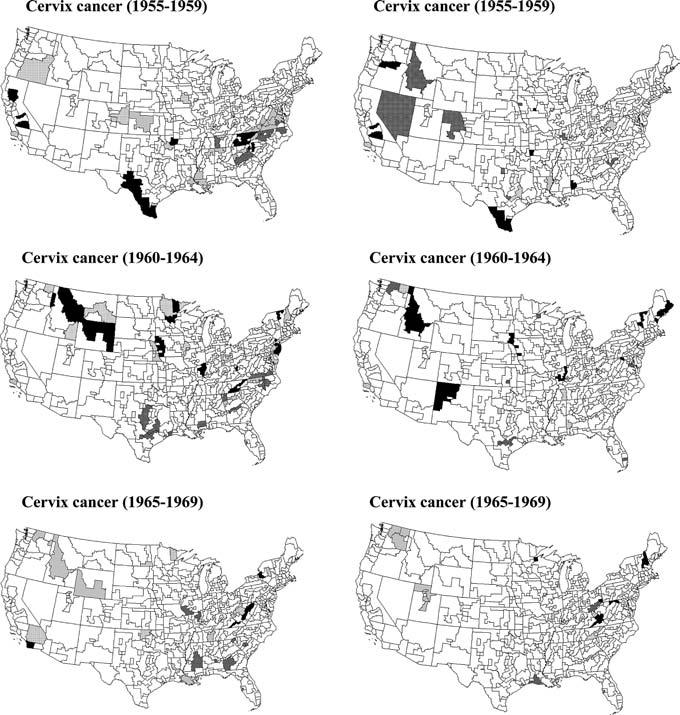
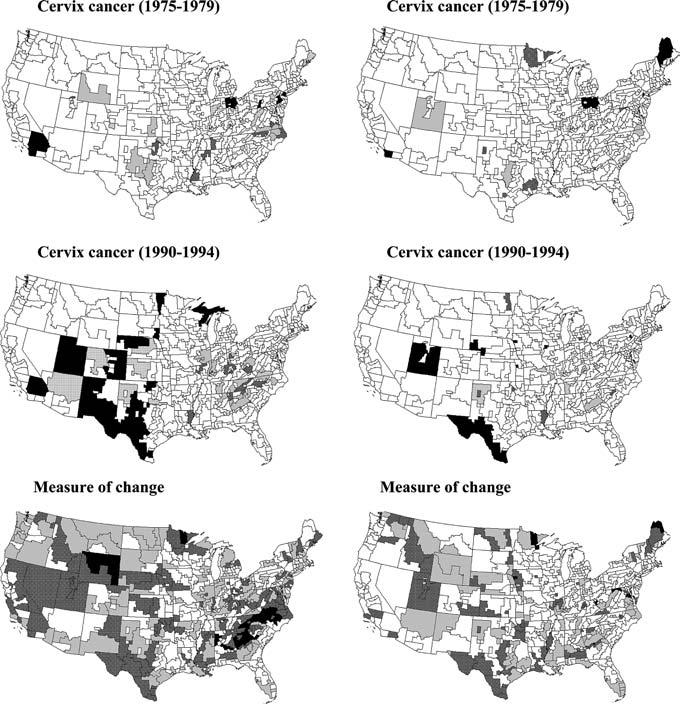
This paper presents the first application of spatially correlated neutral models to the detection of changes in mortality rates across space and time using the local Moran's I statistic. Sequential Gaussian simulation is used to generate realizations of the spatial distribution of mortality rates under increasingly stringent conditions: 1) reproduction of the sample histogram, 2) reproduction of the pattern of spatial autocorrelation modeled from the data, 3) incorporation of regional background obtained by geostatistical smoothing of observed mortality rates, and 4) incorporation of smooth regional background observed at a prior time interval. The simulated neutral models are then processed using two new spatio-temporal variants of the Morany's I statistic, which allow one to identify significant changes in mortality rates above and beyond past spatial patterns. Last, the results are displayed using an original classification of clusters/outliers tailored to the space-time nature of the data. Using this new methodology the space-time distribution of cervix cancer mortality rates recorded over all US State Economic Areas (SEA) is explored for 9 time periods of 5 years each. Incorporation of spatial autocorrelation leads to fewer significant SEA units than obtained under the traditional assumption of spatial independence, confirming earlier claims that Type I errors may increase when tests using the assumption of independence are applied to spatially correlated data. Integration of regional background into the neutral models yields substantially different spatial clusters and outliers, highlighting local patterns which were blurred when local Moran's I was applied under the null hypothesis of constant risk.


Figures

Fig. 1
Fig. 1
Map of cervix cancer mortality (rates per 100,000) for the period 1955–1959 (categories correspond to deciles of the histogram of rates). Bottom graphs show results of local cluster analysis under neutral model I (spatial independence): p-values and the corresponding set of significant outliers and clusters for a 0.009 significance level (Bonferroni adjustment)
Fig. 2
Fig. 2
Histograms of the values of the LISA statistic simulated for SEA unit # 57444 (Del Rio, Texas) under different neutral models. The black dot denotes the observed LISA statistic which lies inside the 0.95 probability interval for all models except the space-time model using LISA statistic (8)
Fig. 3
Fig. 3
Two realizations of the spatial distribution of cervix cancer mortality data based on the assumption of spatial independence (Model I), reproduction of spatial autocorrelation (Model II), and incorporation of the regional background displayed in Fig. 4 (Model III). The grayscale ranges from white (low rates) to black (high rates), and for each realization categories correspond to deciles of the histogram of simulated rates
Fig. 4
Fig. 4
Population-weighted semivariogram for cervix cancer mortality data computed in four directions: N-S, SW-NE, EW, and NW-SE. The semivariogram model (thick solid line) is used by kriging analysis to decompose the original map of mortality rates (Fig. 1) into a smooth map of local means (regional background) and a map of residuals. Grayscale categories correspond to deciles of the histograms of local means and residuals, respectively
Fig. 5
Fig. 5
Results of the local cluster analysis conducted using spatially correlated null models of the type displayed in Fig. 3 (Models II and III). For comparison purposes the bottom graph shows the results of the analysis for the map of residuals displayed in Fig. 4 using a neutral model of type II to account for the spatial autocorrelation of the residuals
Fig. 6
Fig. 6
Maps of cervix cancer data for the period 1950–1954 and the regional background obtained by geostatistical smoothing of the short-range variability (top graphs). This regional background is used to generate the two realizations of the neutral model ST III (middle graphs). Bottom maps show the results of the local cluster analysis under this new model, and the distribution of cervix cancer mortality data for the tested period of 1955–1959. For all continuous variables grayscale categories correspond to deciles of the histogram of displayed values
Fig. 7
Fig. 7
Results of the local cluster analysis under the ST III neutral model for the cervix cancer mortality rates recorded for a series of time periods. Left column corresponds to statistic (8), while right column results are produced by statistic (9)
Fig. 8
Fig. 8
Results of the local cluster analysis under the ST III neutral model for the cervix cancer mortality rates recorded for a series of time periods. Bottom maps show the number of times each SEA unit has been found significant (α = 0.05) over 8 time periods (gray = 2, dark gray = 3–4, black = 5–7). Left column corresponds to statistic (8), while right column results are produced by statistic (9)

References

    1. Anselin L. Local indicators of spatial association – LISA. Geographical Analysis. 1995;27:93–115.
    1. Assunçao RM, Reis EA. A new proposal to adjust Moran's I for population density. Statistics in Medicine. 1999;18:2147–2162. - PubMed
    1. Besag J, Newell J. The detection of clusters in rare diseases. (A).Journal of the Royal Statistical Society. 1991;154:143–155.
    1. Cliff AD, Ord JK. Spatial Processes: Models and Applications. Pion; London: 1981.
    1. Cressie N. Statistics for Spatial Data. Wiley; New York: 1993.

LinkOut - more resources