

Iterative reconstruction of transcriptional regulatory networks: an algorithmic approach
- PMID: 16710450
- PMCID: PMC1463018
- DOI: 10.1371/journal.pcbi.0020052
Iterative reconstruction of transcriptional regulatory networks: an algorithmic approach
Abstract
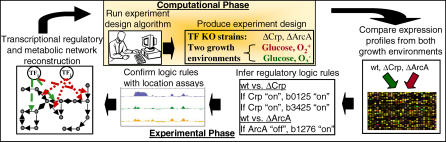
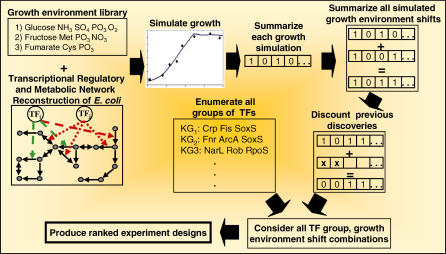
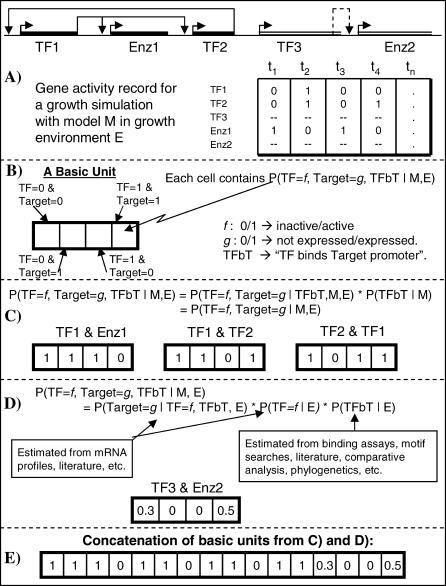
The number of complete, publicly available genome sequences is now greater than 200, and this number is expected to rapidly grow in the near future as metagenomic and environmental sequencing efforts escalate and the cost of sequencing drops. In order to make use of this data for understanding particular organisms and for discerning general principles about how organisms function, it will be necessary to reconstruct their various biochemical reaction networks. Principal among these will be transcriptional regulatory networks. Given the physical and logical complexity of these networks, the various sources of (often noisy) data that can be utilized for their elucidation, the monetary costs involved, and the huge number of potential experiments approximately 10(12)) that can be performed, experiment design algorithms will be necessary for synthesizing the various computational and experimental data to maximize the efficiency of regulatory network reconstruction. This paper presents an algorithm for experimental design to systematically and efficiently reconstruct transcriptional regulatory networks. It is meant to be applied iteratively in conjunction with an experimental laboratory component. The algorithm is presented here in the context of reconstructing transcriptional regulation for metabolism in Escherichia coli, and, through a retrospective analysis with previously performed experiments, we show that the produced experiment designs conform to how a human would design experiments. The algorithm is able to utilize probability estimates based on a wide range of computational and experimental sources to suggest experiments with the highest potential of discovering the greatest amount of new regulatory knowledge.
Conflict of interest statement
Figures
References
-
- Handelsman J. Metagenomics or megagenomics. Nat Rev Microbiol. 2005;3:457–458.
-
- Venter JC, Remington K, Heidelberg JF, Halpern AL, Rusch D, et al. Environmental genome shotgun sequencing of the Sargasso Sea. Science. 2004;304:66–74. - PubMed
-
- Price ND, Reed JL, Palsson BO. Genome-scale models of microbial cells: evaluating the consequences of constraints. Nat Rev Microbiol. 2004;2:886–897. - PubMed
Publication types
MeSH terms
Grants and funding
LinkOut - more resources
Full Text Sources
