

Longitudinal noninvasive PET-based beta cell mass estimates in a spontaneous diabetes rat model
- PMID: 16710474
- PMCID: PMC1462946
- DOI: 10.1172/JCI27645
Longitudinal noninvasive PET-based beta cell mass estimates in a spontaneous diabetes rat model
Abstract
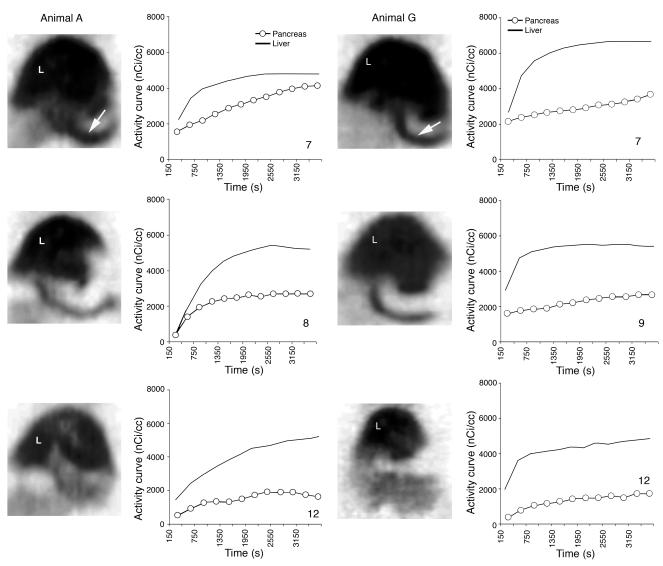
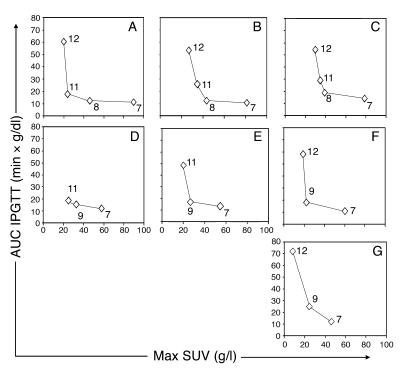
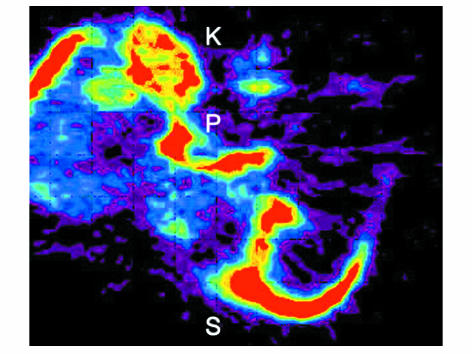
Diabetes results from an absolute or relative reduction in pancreatic beta cell mass (BCM) leading to insufficient insulin secretion and hyperglycemia. Measurement of insulin secretory capacity is currently used as a surrogate measure of BCM. However, serum insulin concentrations provide an imprecise index of BCM, and no reliable noninvasive measure of BCM is currently available. Type 2 vesicular monoamine transporters (VMAT2) are expressed in human islet beta cells, as well as in tissues of the CNS. [11C]Dihydrotetrabenazine ([11C]DTBZ) binds specifically to VMAT2 and is a radioligand currently used in clinical imaging of the brain. Here we report the use of [11C]DTBZ to estimate BCM in a rodent model of spontaneous type 1 diabetes (the BB-DP rat). In longitudinal PET studies of the BB-DP rat, we found a significant decline in pancreatic uptake of [11C]DTBZ that anticipated the loss of glycemic control. Based on comparison of standardized uptake values (SUVs) of [11C]DTBZ and blood glucose concentrations, loss of more than 65% of the original SUV correlated significantly with the development of persistent hyperglycemia. These studies suggest that PET-based quantitation of VMAT2 receptors provides a noninvasive measurement of BCM that could be used to study the pathogenesis of diabetes and to monitor therapeutic interventions.
Figures
References
-
- Franke B., Galloway T.S., Wilkin T.J. Developments in the prediction of type 1 diabetes mellitus, with special reference to insulin autoantibodies. Diabetes Metab. Res. Rev. 2005;21:395–415. - PubMed
-
- Bernard-Kargar C., Ktorza A. Endocrine pancreas plasticity under physiological and pathological conditions. Diabetes. 2001;50(Suppl. 1):S30–S35. - PubMed
-
- Weir G.C., Bonner-Weir S., Leahy J.L. Islet mass and function in diabetes and transplantation. Diabetes. 1990;39:401–405. - PubMed
-
- Sreenan S., et al. Increased beta-cell proliferation and reduced mass before diabetes onset in the nonobese diabetic mouse. Diabetes. 1999;48:989–996. - PubMed
-
- Larsen M.O., et al. Loss of beta-cell mass leads to a reduction of pulse mass with normal periodicity, regularity and entrainment of pulsatile insulin secretion in Gottingen minipigs. Diabetologia. 2003;46:195–202. - PubMed
Publication types
MeSH terms
Substances
Grants and funding
LinkOut - more resources
Full Text Sources
Other Literature Sources
Medical
Research Materials
