. 2006 Aug 20;165(2):182-94.
doi: 10.1016/j.toxlet.2006.03.008. Epub 2006 Apr 18.

Cigarette smoke condensate induces cytochromes P450 and aldo-keto reductases in oral cancer cells

Affiliations

Cigarette smoke condensate induces cytochromes P450 and aldo-keto reductases in oral cancer cells

Nagathihalli S Nagaraj et al. Toxicol Lett. .

Abstract

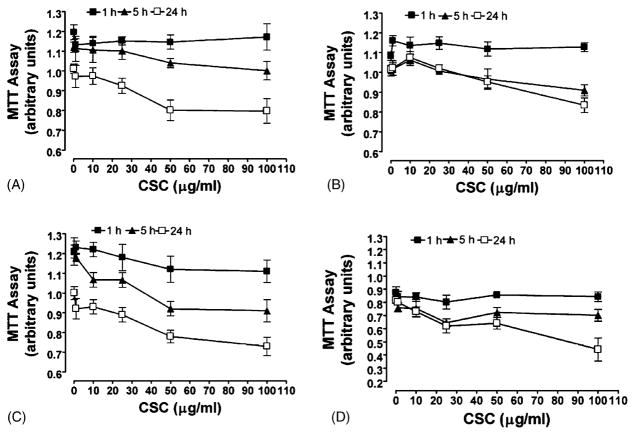
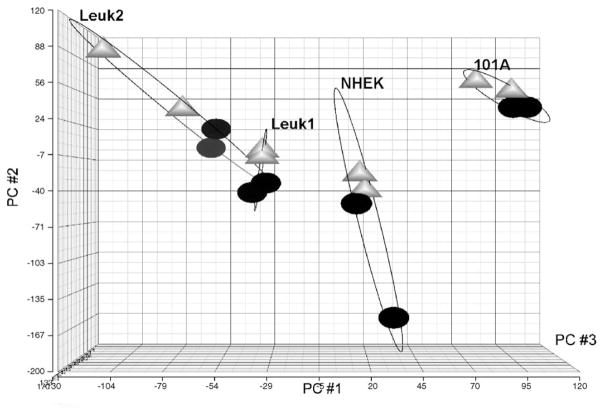
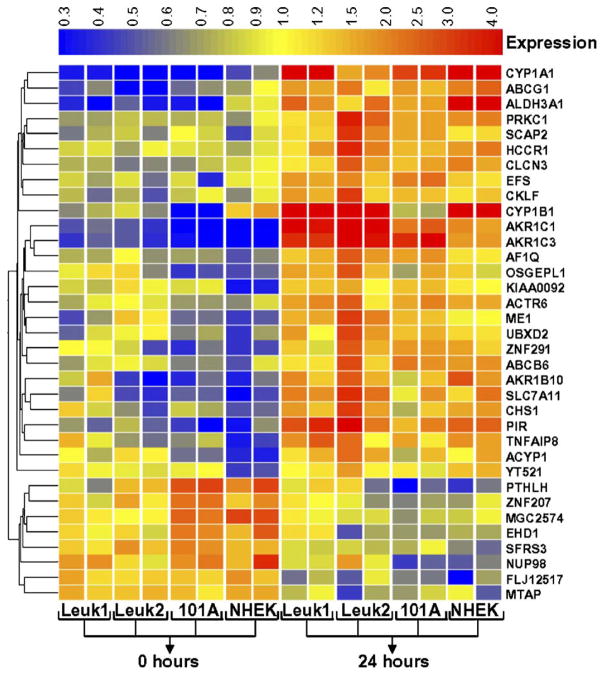
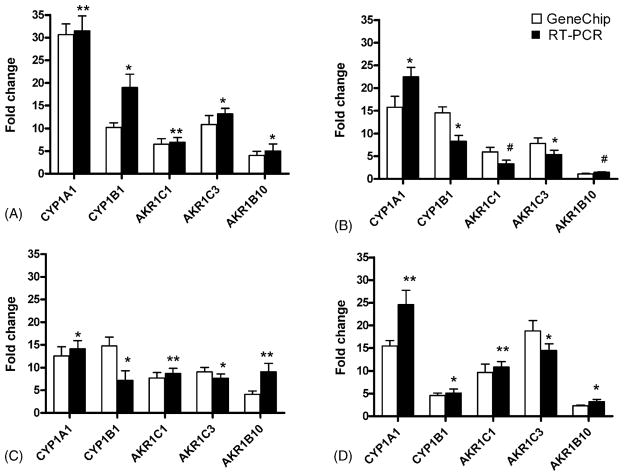
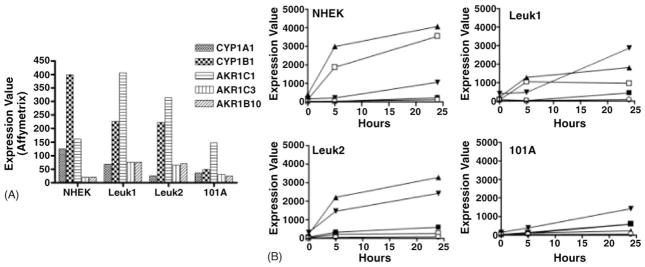
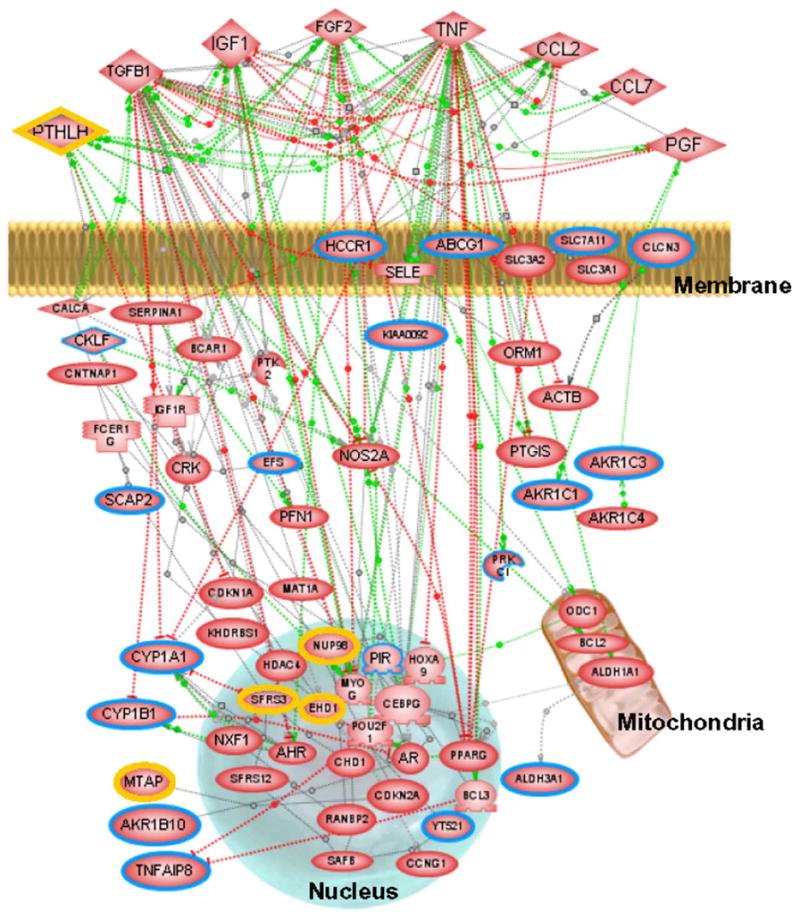
Our objective is to identify molecular factors which contribute to the increased risk of smokers for oral squamous cell carcinoma (OSCC). In the present study, we investigated the effects of cigarette smoke condensate (CSC) on gene expression profiles in different human oral cell phenotypes: normal epidermal keratinocytes (NHEK), oral dysplasia cell lines (Leuk1 and Leuk2), and a primary oral carcinoma cell line (101A). We determined differential gene expression patterns in CSC-exposed versus non-exposed cells using high-density microarray RNA expression profiling and validation by quantitative real-time RT-PCR. A set of 35 genes was specifically up- or down-regulated following CSC treatment (25microg/ml for 24h) by at least 2-fold in any one cell type. Notably, five genes of the cytochrome P450 (CYP1A1, CYP1B1) and aldo-keto reductase (AKR1C1, AKR1C3, AKR1B10) families were highly increased in expression, some of them 15- to 30-fold. The timing and extent of induction for these genes differed among the four cell phenotypes. A potential biological interaction network for the CSC response in oral cells was derived from these data, proposing novel putative response pathways. These CSC-responsive genes presumably participate in the prevention or repair of carcinogen-induced DNA damage in tobacco-related oral carcinogenesis, and may potentially be exploited for determining the severity of exposure and for correcting mutagenic damage in exposed tissues of the oral cavity.


Figures

Fig. 1
Fig. 1
Proliferation of normal human keratinocytes and oral carcinoma cells treated with CSC. A total of 500 cells/well were seeded in 96-well tissue culture plates and treated with 0–100 μg/ml concentrations of CSC for 1 h (■), 5 h (▲) and 24 h (□). After each indicated time/concentration treatment, the growth of cells was evaluated by 3-(4,5-dimethylthiazol-2-yl)-2,5-diphenyltetrazolium bromide (MTT) assay as described in Section 2. (A) NHEK; (B) Leuk1; (C) Leuk2; (D) 101A cells. Results are the mean ± S.D. of three independent assays.
Fig. 2
Fig. 2
Principal component analysis of microarray data to demonstrate similarity of response of the cell types and treatment times. In the plot, each point represents a cell line (NHEK, Leuk1, Leuk2, or 101A) and treatment time (0 h, black circles; 24 h, gray triangles) of CSC exposure (25 μg/ml). The X, Y and Z-axes are PC#1, PC#2 and PC#3, respectively.
Fig. 3
Fig. 3
CSC-induced gene expression profiles. This heat map shows common genes up-regulated or down-regulated in NHEK, Leuk1, Leuk2 and 101A cell lines after CSC treatment (25 μg/ml), as determined by false discovery rate. Genes are displayed horizontally and samples are displayed as vertical columns for cell lines (each in duplicate) and treatment time period (0 h or 24 h). For each gene, relative expression changes are colored to indicate increased (red) and decreased (blue) levels relative to the average across all samples (yellow). Gene expression profiles for 35 genes were tentatively identified as differentially expressed with at least two-fold change in any one cell line compared.
Fig. 4
Fig. 4
Comparative quantitative real-time RT-PCR analysis. RNA from control (0 h) and treated (24 h, 25 μg/ml CSC) cells were subjected to quantitative real-time RT-PCR analysis using primers specific for CYP1A1, CYP1B1, AKR1C1, AKR1C3, AKR1B10, and the internal standard β-actin. (A) NHEK; (B) Leuk1; (C) Leuk2; (D) 101A cells; open bars, microarray data; solid bars, RT-PCR data. The fold change levels on the Y-axis are relative to the expression in untreated cells. Results are expressed as the mean and range of duplicate determinations for microarray data, and as mean ± S.D. of four independent experiments for qRT-PCR data: *p < 0.05; **p = 0.01; #non-significant.
Fig. 5
Fig. 5
CSC-induced expression increases for selected target genes. (A) Basal expression levels in untreated cell lines NHEK, Leuk1, Leuk2, and 101A for the indicated target genes, as measured by microarray-derived target intensities. (B) Time course of induction. For each cell line, target intensities after CSC treatment for 0, 5, and 24 h are plotted for the following genes: CYP1A1 (□); CYP1B1 (▲); AKR1C1 (▼); AKR1C3 (■); AKR1B10 (○).
Fig. 6
Fig. 6
Potential molecular interaction network for the CSC response. A simplified network for genes associated with the CSC response was developed using PathwayAssist. Green lines indicate positive effects, red lines indicate negative effects and gray lines interactions with unknown effect. Colored borders in nodes highlight genes that are up-regulated (blue) or down-regulated (yellow) with at least two-fold change in any one cell type. A complete table of the network genes associated with CSC sensitivity is accessible as Table S1, Supplementary Data online.

References

    1. Alexandrie AK, Sundberg MI, Seidegard J, Tornling G, Rannug A. Genetic susceptibility to lung cancer with special emphasis on CYP1A1 and GSTM1: a study on host factors in relation to age at onset, gender and histological cancer types. Carcinogenesis. 1994;15:1785–1790. - PubMed
    1. Almahmeed T, Boyle JO, Cohen EG, Carew JF, Du B, Altorki NK, Kopelovich L, Fang JL, Lazarus P, Subbaramaiah K, Dannenberg AJ. Benzo[a]pyrene phenols are more potent inducers of CYP1A1, CYP1B1 and COX-2 than benzo[a]pyrene glucuronides in cell lines derived from the human aerodigestive tract. Carcinogenesis. 2004;25:793–799. - PubMed
    1. Bartsch H, Nair U, Risch A, Rojas M, Wikman H, Alexandrov K. Genetic polymorphism of CYP genes, alone or in combination, as a risk modifier of tobacco-related cancers. Cancer Epidemiol Biomarkers Prev. 2000;9:3–28. - PubMed
    1. Burczynski ME, Sridhar GR, Palackal NT, Penning TM. The reactive oxygen species and Michael acceptor-inducible human aldo-keto reductase AKR1C1 reduces the alpha, beta-unsaturated aldehyde 4-hydroxy-2-nonenal to 1,4-dihydroxy-2-nonene. J Biol Chem. 2001;276:2890–2897. - PubMed
    1. Crofts FG, Strickland PT, Hayes CL, Sutter TR. Metabolism of 2-amino-1-methyl-6-phenylimidazo [4,5-b] pyridine (PhIP) by human cytochrome P4501B1. Carcinogenesis. 1997;18:1793–1798. - PubMed

Publication types

MeSH terms