. 2006 Jul;155(1):63-73.
doi: 10.1016/j.jsb.2006.03.006. Epub 2006 Apr 4.

Site-specific 3D imaging of cells and tissues with a dual beam microscope

Affiliations

Site-specific 3D imaging of cells and tissues with a dual beam microscope

Jurgen A W Heymann et al. J Struct Biol. 2006 Jul.

Abstract

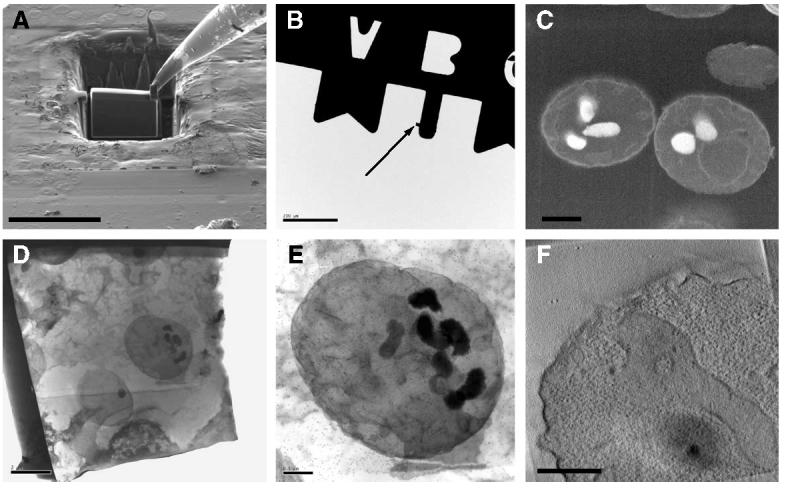
Current approaches to 3D imaging at subcellular resolution using confocal microscopy and electron tomography, while powerful, are limited to relatively thin and transparent specimens. Here we report on the use of a new generation of dual beam electron microscopes capable of site-specific imaging of the interior of cellular and tissue specimens at spatial resolutions about an order of magnitude better than those currently achieved with optical microscopy. The principle of imaging is based on using a focused ion beam to create a cut at a designated site in the specimen, followed by viewing the newly generated surface with a scanning electron beam. Iteration of these two steps several times thus results in the generation of a series of surface maps of the specimen at regularly spaced intervals, which can be converted into a three-dimensional map of the specimen. We have explored the potential of this sequential "slice-and-view" strategy for site-specific 3D imaging of frozen yeast cells and tumor tissue, and establish that this approach can identify the locations of intracellular features such as the 100 nm-wide yeast nuclear pore complex. We also show that 200 nm thick sections can be generated in situ by "milling" of resin-embedded specimens using the ion beam, providing a valuable alternative to manual sectioning of cells and tissues using an ultramicrotome. Our results demonstrate that dual beam imaging is a powerful new tool for cellular and subcellular imaging in 3D for both basic biomedical and clinical applications.


Figures

Fig. 1
Fig. 1
Schematic depicting the principle of focused ion beam milling and scanning electron microscope imaging in a dual beam electron microscope. The ion source (red, left) and the electron source (blue, top) are arranged at an angle allowing the ion beam (Ga+) to remove material from the surface of the specimen (yellow) such that it can be imaged by the scanning electron beam (e). As a result, a trench is generated, thus enabling imaging of the interior of the specimen. As shown, the exposed surface is parallel to the plane of the ion beam, and at an angle of 52 ± 2° to the electron beam.
Fig. 2
Fig. 2
2D and 3D imaging of yeast cells by scanning electron microscopy. Scanning images of cross-sections of plastic-embedded (A and B) and critical point-dried yeast cells (C and D) at low (A and C) and high (B and D) magnification. Resin surface (A) and yeast pellet surface (B) were coated with platinum (white) prior focused ion beam milling. The long white arrows point to the location of the nuclear membrane in the budding yeast cells shown in (B and D), and the short white arrows point to the locations of the vacuoles, which appear black in (A and B) and white in (C and D). (E) 3D visualization of critical point-dried yeast cells was accomplished by iterative focused ion beam milling and scanning electron microscope imaging: segmented rendering of 3D volume displaying cell wall (gray envelope), the vacuolar region (green), and the nucleus (blue) of an individual, budding yeast cell. Rendering was done using the Amira software package (Mercury Computer Systems GmbH, Berlin, Germany). The images in (A and B) were collected using a Strata 400 dual beam microscope, the images in (C and D) using a Nova 600 NanoLab dual beam microscope. Scale bars: (A and C) 10 μm, (B) 2 μm, (D) 0.5 μm.
Fig. 3
Fig. 3
Scanning electron microscope images of yeast cells plunge-frozen in liquid nitrogen and imaged at −140°C. (A–C) Surface images generated by focused ion beam milling depicting progression in the sublimation process initiated by transiently raising the specimen temperature; (D) view of the crosssection of an individual yeast cell exposed by focused ion beam milling and contrasted by sublimation and coating with platinum and palladium. Arrow points to the location of a pore in the nuclear membrane. (E) Scanning electron microscope image of freeze-fractured, platinum–palladium coated yeast cells. Arrow indicates location of nuclear pore. Scale bars: 2 μm. A subset of the data presented in this figure (C and D) was presented in the preliminary report by Mulders (2003) on the potential of combining focused ion beam milling with scanning electron microscopy.
Fig. 4
Fig. 4
Transmission and scanning electron microscope images of chemically fixed, plastic-embedded lymphoid tumor tissue at room temperature, and chemically fixed, plunge-frozen lymphoid tumor tissue at −140 °C. (A) transmission image of a post-stained, ultramicrotome-derived thin section of lymphoid tumor tissue. (B) Scanning image showing the cross-section of an area that was exposed by focused ion beam milling from a region similar to that displayed in (A), and from the same specimen. To facilitate the comparison between (A and B), the contrast of the image in (B) has been inverted. (C) 3D visualization of lymphoid tumor tissue by iterative focused ion beam milling and scanning electron microscope imaging: a series of images such as those shown in (B) (without contrast inversion) were combined in a stack and segmented to visualize selected features (rendered in gold, magenta) of the tissue in 3D. The inset shows a 3D rendering of the central feature in the image stack segmented by density thresholding. (D) Scanning images of platinum–palladium coated lymphoid tumor tissue after focused ion beam milling, which generates a shallow trench exposing an extended cross-section of volume within the tumor tissue. Note that the contrast in (A and B) is the opposite to that of the image in this panel. Scale bars: 5 μm.
Fig. 5
Fig. 5
Scanning (A–C) and transmission (D–F) electron microscope images displaying the preparation, handling, and visualization of a plastic-resin section generated by focused ion beam milling at room temperature. (A) A plastic section (about 12 μm × 16 μm × 1 μm) generated by focused ion beam milling of a block of resin containing chemically fixed yeast cells. The section is tethered on the upper right corner to an Omniprobe sample needle by ion deposition. (B) The section (indicated by arrow) after attachment to a half-grid and release from the Omniprobe sample needle. A view at higher magnification is presented in (C). Prior to imaging for tomography, the section was further processed by focused ion beam milling to a lamella of about 200 nm thickness. (D and E) Transmission images of a lamella that was negatively stained and decorated with 15 nm gold particles used as fiducial markers for tomographic experiments. (F) A tomographic slice obtained from a 3D volume reconstruction of a region in the section. Each of the black dots, indicated by the white arrow, roughly corresponds to the staining of a single ribosome in the cytoplasm. The image in (B) was collected using a Tecnai 12 microscope operating at 120 kV and the images in (D–F) were collected using a Tecnai F30 microscope operating at 300 V. Scale bars: (A) 20 μm, (B) 200 μm, (C) 1μm, (D) 2 μm, (E and F) 0.5 μm.
Fig. 6
Fig. 6
Preparation of specimen with cylindrical geometry by focused ion beam milling. (A) A scanning electron microscope image of a precursor to the final cylindrical specimen (B) that was obtained by focused ion beam milling from a slab of resin containing chemically fixed yeast cells. The outline of an individual yeast cell is visible within the specimen as an oval area of high contrast. A platinum layer is present on the top of the precursor that is mounted to a copper support grid visible at the bottom. (B) The final needle-like specimen is seen. (C) A transmission electron microscope image of the specimen shown in (B); at the top of the needle, the remaining layer of platinum is visible; within the needle, lighter areas represent the resin matrix while dark, oval areas originate from yeast cells embedded in the matrix. The copper support is visible at the bottom. Inset (C), a projection image of a subvolume from a single yeast cell is shown at higher magnification. Scanning electron microscope images were collected using a Nova 600 NanoLab microscope operating at 5 kV and transmission electron microscope images were collected using a Sphera G2 microscope operating at 200 kV. Scale bars: (A–C), 2 μm, insets, 0.5 μm.

References

    1. Ballerini M, Milani M, Batani M, Squadrini F. Focused ion beam techniques for the analysis of biological samples: a revolution in ultramicroscopy? Proc. SPIE. 2001;4261:92–104.
    1. Barnard DP, Turner JN, Frank J, McEwen BF. A 360 degrees single-axis tilt stage for the high-voltage electron microscope. J. Microsc. 1992;167(Pt 1):39–48. - PubMed
    1. Bauer C, Herzog V, Bauer MF. Improved technique for electron microscope visualization of yeast membrane structure. Microsc. Microanal. 2001;7:530–534. - PubMed
    1. Denk W, Horstmann H. Serial block-face scanning electron microscopy to reconstruct three-dimensional tissue nanostructure. PLoS Biol. 2004;2:e329. - PMC - PubMed
    1. Drobne D, Milani M, Zrimec A, Zrimec MB, Tatti F, Draslar K. Focused ion beam/scanning electron microscopy studies of Porcellio scaber (Isopoda, Crustacea) digestive gland epithelium cells. Scanning. 2005;27:30–34. - PubMed

Publication types

LinkOut - more resources