. 2006 Aug 1;91(3):1046-58.
doi: 10.1529/biophysj.106.084830. Epub 2006 May 19.

Membrane lateral diffusion and capture of CFTR within transient confinement zones

Affiliations

Membrane lateral diffusion and capture of CFTR within transient confinement zones

Ian R Bates et al. Biophys J. .

Abstract

The cystic fibrosis transmembrane conductance regulator (CFTR) channel interacts with scaffolding and other proteins that are expected to restrict its lateral movement, yet previous studies have reported predominantly free diffusion. We examined the lateral mobility of CFTR channels on live baby hamster kidney cells using three complementary methods. Channels bearing an extracellular biotinylation target sequence were labeled with streptavidin conjugated with fluorescent dyes (Alexa Fluor 488 or 568) or quantum dots (qDot605). Fluorescence recovery after photobleaching and image correlation spectroscopy of the dye-labeled channels revealed a significant immobile population ( approximately 50%), which was confirmed by direct single particle tracking (SPT) of qDot605-labeled CFTR. Adding 10 histidine residues at the C-terminus of CFTR to mask the postsynaptic density 95, Discs large, ZO-1 (PDZ) binding motif abolished its association with EBP50/NHERF1, reduced the immobile fraction, and increased mobility. Other interactions that are not normally detected on this timescale became apparent when binding of PDZ domain proteins was disrupted. SPT revealed that CFTR(His-10) channels diffuse randomly, become immobilized for periods lasting up to 1 min, and in some instances are recaptured at the same location. The impact of transient confinement on the measured diffusion using the three fluorescence techniques were assessed using computer simulations of the biological experiments. Finally, the impact of endosomal CFTR on mobility measurements was assessed by fluorescence correlation spectroscopy. These results reveal unexpected features of CFTR dynamics which may influence its ion channel activity.


Figures

FIGURE 1
FIGURE 1
Expression and labeling of CFTR on live BHK cells. (a) Diagram illustrating the enzymatic biotinylation of CFTR on the cell surface. (b and c) Low magnification fluorescence images of BHK cells stably expressing CFTR-biotintag. (b) Cells were exposed to the biotin ligase BirA for 40 min at 30°C and incubated with Streptavidin-Alexa Fluor 488. (c) In the absence of BirA, there was little nonspecific binding. Scale bar, 20 μm. (d) Western blot of wild-type His tagged CFTR purified using Ni2+-NTA beads (48) (lane 1) and CFTR-biotintag (lane 2). Arrow indicates location of standard at 175 kDa. (e) Western blot of CFTR-biotintag after incubation with streptavidin. Solid arrow indicates the monomeric, complex-glycosylated protein at 175 kDa. The open arrow indicates 350 kDa dimers stabilized by streptavidin pretreatment.
FIGURE 2
FIGURE 2
Distribution and lateral mobility of biotinylated CFTR and CFTRHis-10 studied by FRAP and ICS. (a) High magnification image of the upper surface of a labeled cell. The white square indicates a 32 × 32 pixel area that was analyzed to produce a stack of 100 consecutive images collected at 1–2-s intervals. Scale bar, 5 μm. (b) Selected images from a confocal FRAP experiment at 37°C of CFTR-biotintag labeled with Streptavidin-Alexa Fluor 488 expressed in BHK cells. Nos. 1–3 represent the bleach box, whole cell fluorescence, and background fluorescence, respectively. Bleach box length, 5 μm. Scale bar, 4 μm. (c and d) Fluorescence recovery kinetics for CFTR (c) and CFTRHis-10 (d). Note the smaller immobilized fraction with CFTRHis-10. (e and f) Normalized temporal intensity fluctuation autocorrelation function from CFTR (e) and CFTRHis-10 (f) with solid line curve of best fit to the 2D diffusion model (see Materials and Methods). Representative of 20 cells imaged on different days.
FIGURE 3
FIGURE 3
(a) Schematic of the EBP50/NHERF1 interaction with the PDZ domain binding motif at the C-terminus of CFTR, which is masked (b) by the addition of the decahistidine tag. (c) Western blot of an avidin pulldown of biotinylated CFTR. CFTR and CFTRHis-10 were enzymatically biotinylated, pulled down on avidin beads, and analyzed by Western blotting with anti-NHERF1 antibody. Lane 1, pulldown of CFTRHis-10 expressed in BHK cells; lane 2, pulldown using CFTR-expressing BHK cells. Lanes 3 and 4 show the protein in crude lysates obtained using cells that express CFTRHis-10 or CFTR, respectively. The solid arrow represents the molecular mass marker at 47.5 kDa.
FIGURE 4
FIGURE 4
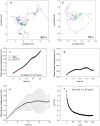
SPT and ICS of CFTRHis-10 labeled with quantum dots (QD) after enzymatic biotinylation. (a) Example of a QD trajectory obtained by analysis of an LSM image time series consisting of 743 time steps collected over 360 s. The colored tracks indicate regions of confinement. (b) Higher zoom portion of the trajectory from (a) which shows the revisitation of confinement zones (frames 350–470, time sampling of 0.483 s/frame). MSD as a function of time for regions outside of confinement zones (c) and within confinement zones (d) for the particle tracked in (a). The measured D from the analysis of MSD versus time curves was 3.0 ± 1.0 × 10⁻² μm2s−1. (e) MSD as a function of time calculated for an ensemble of trajectories (N = 32). (f) Normalized temporal intensity fluctuation autocorrelation function measured from a cell labeled with CFTRHis-10/QD. The D is determined from the best parameters for a 2D diffusion decay model (solid line).
FIGURE 5
FIGURE 5
Enzymatically biotinylated CFTR labeled with Streptavidin-Alexa 488. (a) Laser scanning microscope image of the apical membrane of BHK cells with labeled CFTR-biotintag and the location of the confocor focus (cross-hair). Scale bar, 5 μm. (b) Illustration showing the FCS illumination volume positioned on the apical membrane where CFTR in the plasma membrane and in endocytic vesicles is detected. (c) Autocorrelation curves of free Streptavidin-Alexa 488 in solution. (d) Average autocorrelation curve of the last 4 × 10 s intervals of the FCS measurement. The first 10 s of the count rate decayed sharply during the measurement, consistent with the bleaching of the slowly moving CFTR in the membrane.
FIGURE 6
FIGURE 6
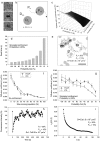
Imaging simulations of freely diffusing and transiently confined point particles and the results of FRAP and ICS lateral mobility measurements. (a) Images from a simulated FRAP experiment. Bleach box, 5 μm. Scale bar, 5 μm. (b) Scheme for simulating transient confinement, where Pin and Pout represent the probability of entering and exiting a domain, and Din and Dout represent the diffusion coefficient inside and outside the domain, respectively. The domain diameter was 200 nm, and the number of domains used was 120 in a 128 × 128 pixel region. (c) 3D mesh graph showing the percentage confinement as a function of Pin and Pout. (d) Dwell times within confinement zones as Pout is decreased with Pin set at 30%. (e) Simulation of an SPT experiment showing transient confinement similar to that observed during the SPT experiment shown in Fig. 4 a. (Din = 3.0 × 10⁻³ μm2s−1, Dout = 3.0 × 10⁻² μm2s−1, Pin = 30%, Pout = 15%, total time = 360 s). Scale bar, 0.5 μm. (f) ICS and FRAP measured diffusion coefficients for simulations of two diffusing populations with no confinement (Dslow = 3.0 × 10⁻³ μm2s−1, Dfast = 3.0 × 10⁻² μm2s−1), as a function of the fraction of the slower diffusing population. (g) ICS and FRAP measured diffusion coefficients for simulations with transient confinement showing the effect of increasing Pout. (h) FRAP recovery kinetics of a simulated confinement experiment using the same parameters as in e. (i) ICS autocorrelation function of a simulated confinement experiment using the same parameters as in e.

References

    1. Riordan, J. R., J. M. Rommens, B. Kerem, N. Alon, R. Rozmahel, Z. Grzelczak, J. Zielenski, S. Lok, N. Plaversusic, and J. L. Chou. 1989. Identification of the cystic fibrosis gene: cloning and characterization of complementary DNA. Science. 245:1066–1073. - PubMed
    1. Voltz, J. W., E. J. Weinman, and S. Shenolikar. 2001. Expanding the role of NHERF, a PDZ-domain containing protein adapter, to growth regulation. Oncogene. 20:6309–6314. - PubMed
    1. Li, C., K. Roy, K. Dandridge, and A. P. Naren. 2004. Molecular assembly of cystic fibrosis transmembrane conductance regulator in plasma membrane. J. Biol. Chem. 279:24673–24684. - PubMed
    1. Milewski, M. I., J. E. Mickle, J. K. Forrest, D. M. Stafford, B. D. Moyer, J. Cheng, W. B. Guggino, B. A. Stanton, and G. R. Cutting. 2001. A PDZ-binding motif is essential but not sufficient to localize the C terminus of CFTR to the apical membrane. J. Cell Sci. 114:719–726. - PubMed
    1. Raghuram, V., D. D. Mak, and J. K. Foskett. 2001. Regulation of cystic fibrosis transmembrane conductance regulator single-channel gating by bivalent PDZ-domain-mediated interaction. Proc. Natl. Acad. Sci. USA. 98:1300–1305. - PMC - PubMed

Publication types