. 2006 Jun 12;203(6):1481-92.
doi: 10.1084/jem.20060136. Epub 2006 May 22.

A cyanobacterial LPS antagonist prevents endotoxin shock and blocks sustained TLR4 stimulation required for cytokine expression

Affiliations

A cyanobacterial LPS antagonist prevents endotoxin shock and blocks sustained TLR4 stimulation required for cytokine expression

Annalisa Macagno et al. J Exp Med. .

Abstract

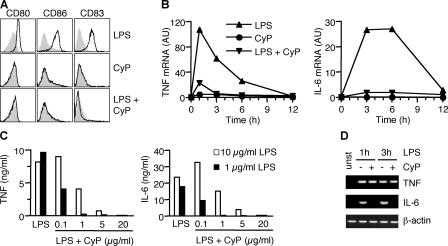
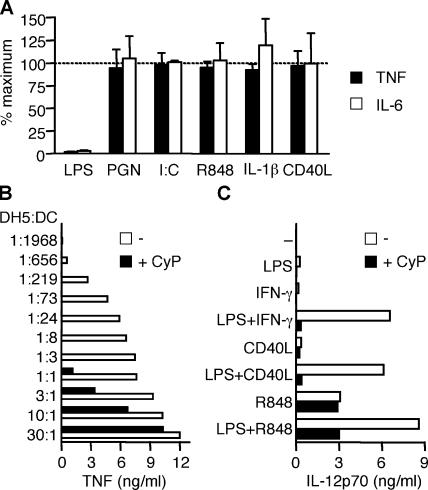
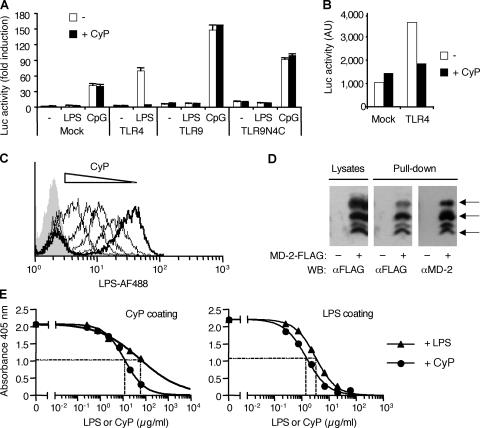
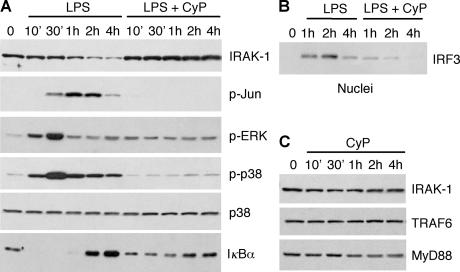
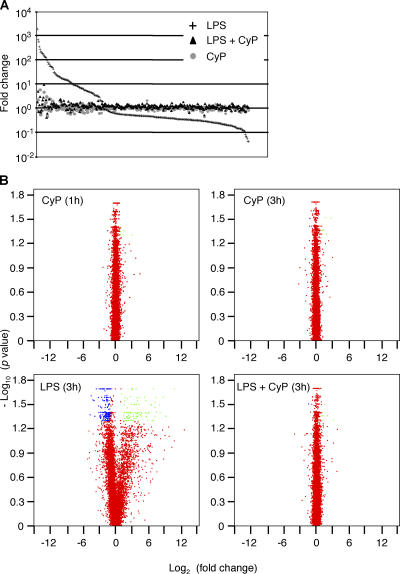
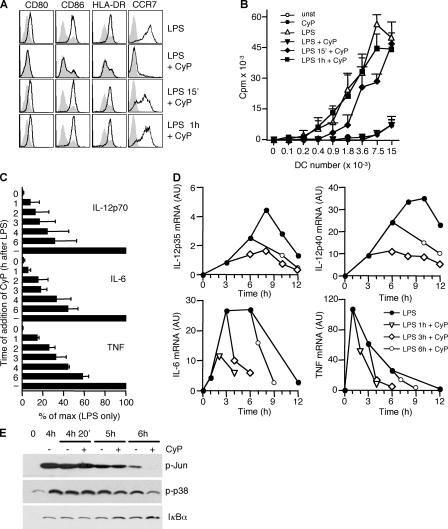
Toll-like receptors (TLRs) function as primary sensors that elicit coordinated innate immune defenses through recognition of microbial products and induction of immune and proinflammatory genes. Here we report the identification and biological characterization of a lipopolysaccharide (LPS)-like molecule extracted from the cyanobacterium Oscillatoria Planktothrix FP1 (cyanobacterial product [CyP]) that is not stimulatory per se but acts as a potent and selective antagonist of bacterial LPS. CyP binds to MD-2 and efficiently competes with LPS for binding to the TLR4-MD-2 receptor complex. The addition of CyP together with LPS completely inhibited both MyD88- and TRIF-dependent pathways and suppressed the whole LPS-induced gene transcription program in human dendritic cells (DCs). CyP protected mice from endotoxin shock in spite of a lower capacity to inhibit LPS stimulation of mouse DCs. Interestingly, the delayed addition of CyP to DCs responding to LPS strongly inhibited signaling and cytokine production by immediate down-regulation of inflammatory cytokine mRNAs while not affecting other aspects of DC maturation, such as expression of major histocompatibility complex molecules, costimulatory molecules, and CCR7. Collectively, these results indicate that CyP is a potent competitive inhibitor of LPS in vitro and in vivo and reveal the requirement of sustained TLR4 stimulation for induction of cytokine genes in human DCs.


Figures

Figure 1.
Figure 1.
CyP inhibits LPS-induced activation of human DCs in a dose-dependent manner. (A) Human monocyte-derived DCs were treated with 1 μg/ml LPS and 20 μg/ml CyP alone or in combinations. After 16 h, expression of CD80, CD86, and CD83 was measured. Untreated DCs are shown in each panel as a gray profile. One representative experiment of six is shown. (B) Kinetics of TNF and IL-6 mRNA expression in DCs treated with LPS (▴), CyP (•), or LPS and CyP (▾) as measured by quantitative real-time RT-PCR. One representative experiment of five is shown. Fig. S2 shows additional transcript analysis. (C) DCs were stimulated with 10 (white bars) or 1 (black bars) μg/ml LPS in the absence or presence of graded amounts of CyP. After 20 h, TNF and IL-6 were measured in the culture supernatants by ELISA. One representative experiment of three is shown. (D) Nascent mRNA was isolated from the nuclei of DCs before (unst) and 1 or 3 h after stimulation by LPS in the absence (−) or presence (+) of CyP, and PCR was performed using specific primers.
Figure 2.
Figure 2.
CyP specifically inhibits LPS stimulation of DCs. (A) DCs were stimulated for 16 h with different TLR agonists (1 μg/ml LPS, 10 μg/ml PGN, 20 μg/ml poly(I:C), and 2.5 μg/ml R848), 20 ng/ml IL-1β, or 1 μg/ml soluble CD40L in the absence or presence of 20 μg/ml CyP. Data are expressed as the percentage of the response (TNF production, black bars; IL-6 production, white bars) obtained with the specific agonists in the absence of CyP and represent the mean ± SD of four independent experiments. Inhibition of LPS was found to be statistically significant (P < 0.0001), whereas inhibition of all other stimuli was found to be nonsignificant (P > 0.05). (B) DCs were challenged with graded numbers of DH5α bacteria in the absence (white bars) or presence (black bars) of 20 μg/ml CyP. TNF was measured in the 20-h culture supernatants by ELISA. CyP did not affect bacterial growth. One representative experiment of three is shown. (C) DCs were stimulated with LPS, 10 ng/ml IFN-γ, soluble CD40L, or R848 alone or in the indicated combinations in the absence (white bars) or presence (black bars) of CyP. IL-12p70 was measured in the 24-h culture supernatants. One representative experiment of four is shown.
Figure 3.
Figure 3.
CyP inhibits LPS at the level of MD-2–TLR4 extracellular domain. (A) Luciferase activity of Jurkat cells transfected with a 3×NF-κB–driven luciferase reporter together with empty vector (Mock) or expression vectors encoding either TLR4, TLR9, or a chimera of extracellular TLR9 and intracellular TLR4 (TLR9N4C) and stimulated with 1 μg/ml LPS or 3 μM CpG. Reporter activity was measured after 16 h of LPS stimulation in the absence (white bars) or presence (black bars) of 20 μg/ml CyP. Similar results were obtained at 6 h of stimulation. Data represent the mean ± SD of duplicates of one experiment of two performed with identical results. (B) Spontaneous luciferase activity in Jurkat cells transfected with a 3×NF-κB–driven luciferase reporter together with an empty vector (Mock) or an expression vector encoding TLR4. Reporter activity in the absence (white bars) or presence (black bars) of CyP was measured 40 h after transfection in a 6-h assay. (C) Monocytes were stained with LPS conjugated to Alexa Fluor 488 (0.25 μg/ml LPS-AF488) in the absence (thick line) or presence (thin lines) of increasing concentrations of CyP (0.25, 12.5, 125, and 250 μg/ml) and analyzed by FACS. Background fluorescence of monocytes is shown as a gray profile. One representative experiment of four is shown. Fig. S3 shows the EC50 of CyP inhibiting LPS binding. (D) HEK293T cells mock transfected or transfected with MD-2–FLAG were either lysed and probed for MD-2 expression with anti-FLAG antibodies or treated with 20 μg/ml biotinylated CyP. Biotinylated CyP was then captured with immobilized streptavidin, and MD-2 coprecipitates were detected with anti-FLAG antibodies. Stripped blots were subsequently probed with anti–MD-2 antibodies. Arrows indicate specific bands of differentially glycosylated MD-2 (reference 63). (E) Recombinant human MD-2 (1 μg/ml, fixed concentration) was incubated in wells coated with CyP (left) or LPS (right) in the presence of increasing concentrations of soluble LPS or CyP (0.24, 0.74, 2.22, 6.66, 20, and 60 μg/ml). MD-2 bound to the coated plate was then detected by a specific anti–MD-2 antibody followed by horseradish peroxidase–conjugated secondary antibody. EC50 values were calculated on sigmoidal dose–response curves (variable slope; R squared, 0.9953 or 0.9939 and 0.9692 or 0.9996 for CyP and LPS on CyP or LPS coat, respectively). Data shown are from one experiment of two performed with identical results.
Figure 4.
Figure 4.
CyP inhibits MyD88-dependent and -independent signaling. Immunoblot of cell lysates of DCs stimulated for different times with 0.4 μg/ml LPS in the absence or presence of 20 μg/ml CyP (A and B) or with CyP alone (C). IRF3 in B was detected in the nuclear fraction. One representative experiment of four is shown.
Figure 5.
Figure 5.
CyP inhibits LPS-induced gene expression. Affymetrix methodology was used for global analysis of gene transcription. DCs from two different donors were left untreated (control), treated with 20 μg/ml CyP for 1 or 3 h, or treated with 0.5 μg/ml ultrapure LPS in the absence or presence of CyP for 3 h. (A) Genes showing a statistically significant change (P < 0.05) in at least one experimental condition versus control (321 genes) are ordered on the x axis according to decreasing “fold change” expression (relative to control) induced by LPS treatment. For each gene, the fold changes subsequent to different treatments are shown on the y axis. (B) Volcano plots of the fold changes between treated (1 h CyP, 3 h CyP, and 3 h LPS in the presence or absence of CyP) and untreated DCs for the 12,656 expressed genes. Green, transcripts with at least twofold up-regulation with P < 0.05; blue, transcripts with at least twofold down-regulation with P < 0.05; red, transcripts with fold change less than 2 or P > 0.05. See Table S1 for the list of all expressed gene transcripts.
Figure 6.
Figure 6.
CyP interferes with LPS-induced cytokine production even when added several hours after LPS. DCs were stimulated with 0.4 μg/ml LPS, and 20 μg/ml CyP was added at various time intervals. (A) Cells were analyzed for CD80, CD86, and HLA-DR 20 h after stimulation and for CCR7 44 h after stimulation. Shadowed profiles correspond to unstimulated cells. One representative experiment out of five is shown. (B) Graded numbers of DCs stimulated as in A were cultured with allogeneic naive CD4+ T cells, and proliferation was measured on day 5 by [3H]thymidine incorporation and expressed as cpm. Data represent the mean ± SD of duplicates of one experiment of four performed. (C) DCs were stimulated with LPS, and CyP was subsequently added at the indicated time points. Cytokines released in the culture supernatants at 20 h were measured by ELISA and expressed as percentage of production in absence of CyP addition (−). Data represent the mean ± SD of three independent experiments. (D) DCs were stimulated with LPS in replicate cultures. The cells were left untreated (•) or CyP was added after 1 (▿), 3 (⋄), or 6 (○) h. The kinetics of cytokine-specific transcripts were determined by quantitative real-time RT-PCR. One representative experiment of three is shown. Fig. S4 reports the kinetics of CCL5 transcripts. (E) After 4 h of LPS stimulation, DCs were left untreated or CyP was added to the culture. Cell lysates were prepared 20 min, 1 h, or 2 h after the addition of CyP and analyzed by Western blot with antibodies specific for phosphorilated c-Jun, phosphorilated p38, or IκBα.
Figure 7.
Figure 7.
CyP inhibits LPS-induced endotoxin shock in mice. (A) C57BL/6 mice were sensitized with d-galactosamine and injected i.p. with 25 ng S. abortus equi LPS alone (13 mice, ⋄) or in combination with 750 μg CyP (12 mice, •). (B) C57BL/6 mice were injected i.p. with 1.5 mg E. coli 055:B5 LPS alone (6 mice, ⋄) or in combination with 850 μg CyP (10 mice, •). p-values calculated by the Kaplan-Meyer log-rank test are indicated.

References

    1. Iwasaki, A., and R. Medzhitov. 2004. Toll-like receptor control of the adaptive immune responses. Nat. Immunol. 5:987–995. - PubMed
    1. Lanzavecchia, A., and F. Sallusto. 2001. Regulation of T cell immunity by dendritic cells. Cell. 106:263–266. - PubMed
    1. Banchereau, J., and R.M. Steinman. 1998. Dendritic cells and the control of immunity. Nature. 392:245–252. - PubMed
    1. Reis e Sousa, C. 2001. Dendritic cells as sensors of infection. Immunity. 14:495–498. - PubMed
    1. Kapsenberg, M.L. 2003. Dendritic-cell control of pathogen-driven T-cell polarization. Nat. Rev. Immunol. 3:984–993. - PubMed

Publication types

MeSH terms