. 2006 May 22;34(9):2812-9.
doi: 10.1093/nar/gkl325. Print 2006.

Yeast Protein Interactome topology provides framework for coordinated-functionality

Affiliations

Yeast Protein Interactome topology provides framework for coordinated-functionality

André X C N Valente et al. Nucleic Acids Res. .

Abstract

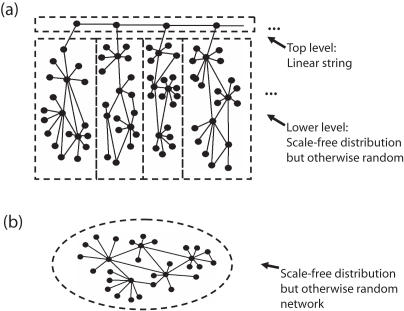
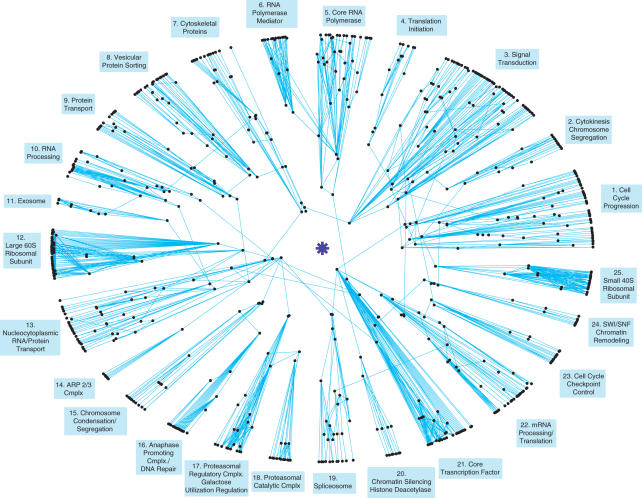
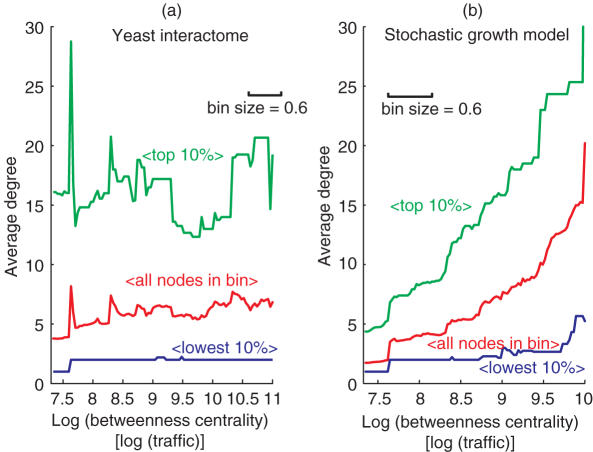
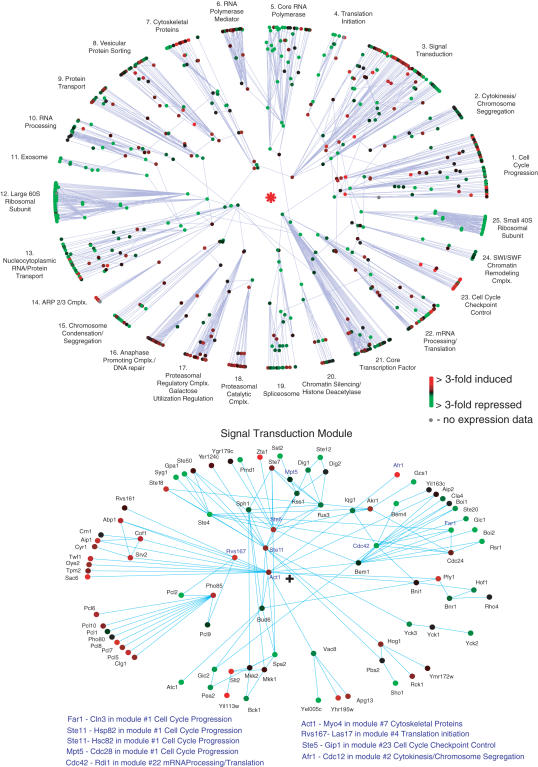
The architecture of the network of protein-protein physical interactions in Saccharomyces cerevisiae is exposed through the combination of two complementary theoretical network measures, betweenness centrality and 'Q-modularity'. The yeast interactome is characterized by well-defined topological modules connected via a small number of inter-module protein interactions. Should such topological inter-module connections turn out to constitute a form of functional coordination between the modules, we speculate that this coordination is occurring typically in a pairwise fashion, rather than by way of high-degree hub proteins responsible for coordinating multiple modules. The unique non-hub-centric hierarchical organization of the interactome is not reproduced by gene duplication-and-divergence stochastic growth models that disregard global selective pressures.


Figures

Figure 1
Figure 1
Hidden intrinsic hierarchy in networks. In this example sketch, network (a) has two hierarchical levels: it consists of a linear string of nodes at the top level that connect to a lower level set of subgraphs possessing scale-free degree distributions, but that are otherwise random. Network (b) has only one hierarchical level, also with a scale-free degree distribution and random in other respects. Arguably, for many applications the difference between topology (a) and topology (b) is of relevance. Yet, an analysis based on common measures such as degree distribution (11,12), clustering coefficient as a function of degree (11,44), or degree correlation measures (61), to name a few, would indicate networks (a) and (b) to be topologically identical. This is due to the much larger number of nodes at the lower hierarchical level statistically overwhelming, and therefore hiding, the top level structure.
Figure 2
Figure 2
S.cerevisiae interactome polar map. The map is constructed, in an unsupervised manner, based solely on protein–protein interaction data. The module captions (blue text boxes) were manually chosen, a posteriori, to reflect the biological role of each module. The map suggests a ‘coordinated-functionality’ architecture for the interactome, arguably an ideal framework for the cell to physically implement the concept of distinct, yet coordinated, biological functional modules. This would be a pairwise-coordination, as inter-module physical interactions occur in a pairwise fashion: of the 76 proteins that possess inter-modular connections, only four connect their module to more than a single other module (TAF25 in module #21 and SRP1 in module #13 have links to four other modules, while NUP1 in module #13 and CLB2 in module #1 have links to two other modules). The map is based on the higher confidence FYI protein–protein interaction dataset (10), consisting of interactions validated either through small-scale experiments or through at least two distinct procedures. The giant connected component, shown here, consists of 741 proteins and 1752 protein–protein interactions.
Figure 3
Figure 3
A non-hub-centric hierarchical organization. In the yeast interactome (a), the degree distribution does not change greatly as one moves from the periphery to the center of the Figure 2 polar map (i.e, as one moves from a low to a high traffic region). In other words, hubs are not hierarchically central in the yeast interactome. In contrast, gene duplication and divergence interactome stochastic growth models [–47] produce hub-centric interactomes, where the average degree markedly increases with traffic and the hierarchical center of the interactome is therefore dominated by hubs. (a) Analysis for the yeast interactome giant connected component, based on the FYI data set (741 proteins, 1752 interactions) [10]. Red curve—the average degree for the set of nodes whose log (traffic) value falls within 0.3 of the log (traffic) value indicated in the x-axis. That is, a log (traffic) bin of size 0.6 is continuously slid along the log (traffic) axis and the average degree for all the nodes that fall within the bin is calculated. The last bin also includes all nodes with a log (traffic) value larger than the range shown in the figure. The bins cover the entire data set, with every bin containing at least 26 nodes. The first bin contains 417 nodes. The last bin contains 37 nodes. Green curve—similar to the red curve, except this time the degree average is done only over the 10% largest degree nodes in the bin. Blue curve—similar to green curve, but this time averaging over the 10% lowest degree nodes in the bin. The average degree in the highest traffic bin (rightmost data point in the red curve) is only 0.42 times the average degree of the 10% largest degree nodes in the lowest traffic bin (leftmost data point in the green curve). (b) Corresponding plots for the giant component of an interactome evolved under the gene duplication and divergence stochastic growth model of Pastor-Satorras et al. [45]. In this case, the giant component contains 759 nodes and 1542 interactions. Every bin contains at least 26 nodes. The first and last bins contain 432 and 40 nodes, respectively. The average degree in the highest traffic bin is now 4.6 times larger than the average degree of the 10% largest degree nodes in the lowest traffic bin. Similar results were achieved under multiple trials, model parameters and gene duplication growth models (Supplementary data.).
Figure 4
Figure 4
Overlay of 20 min post heat shock mRNA expression data (62) upon the interactome polar map. Maps are constructed as in Figure 2 and Supplementary Fig. 8 (proteins connected to other modules in the global map have names in blue). In addition, node color indicates mRNA expression level. As previously reported (62), there is a sharp decline in expression of mRNA for ribosomal proteins. Other modules with a significant proportion of constituent proteins showing a decline are the Translation Initiation and Core RNA Polymerase modules. These observations are consistent with the repression of genes involved in RNA and protein synthesis upon heat shock (62). Modules with a significant proportion of constituent proteins showing an increase in expression are the small Cell Cycle Checkpoint Control module and parts of the Signal Transduction and Cell Cycle Progression modules. Overlay of mRNA expression data upon the single module maps of the latter two modules shows clear over expression in the protein chaperone submodule of CellCycle Progression (Supplementary Fig. 9), and into the phosph-cyclin and cell growth/morphogenesis submodules of Signal Transduction (above). The increased expression of genes in these submodules supports the notion that cell growth is checked upon heat shock.

References

    1. Eisenberg D., Marcotte E.M., Xenarios I., Yeates T.O. Protein function in the post-genomic era. Nature. 2000;405:823–826. - PubMed
    1. Lu H., Zhu X., Liu H., Skogerbo G., Zhang J., Zhang Y., Cai L., Zhao Y., Sun S., Xu J., et al. The interactome as a tree—an attempt to visualize the protein-protein interaction network in yeast. Nucleic Acids Res. 2004;32:4804–4811. - PMC - PubMed
    1. Vidal M. A biological atlas of functional maps. Cell. 2001;104:333–339. - PubMed
    1. Bader G.D., Heilbut A., Andrews B., Tyers M., Hughes T., Boone C. Functional genomics and proteomics: charting a multidimensional map of the yeast cell. Trends Cell Biol. 2003;13:344–356. - PubMed
    1. Sharom J.R., Bellows D.S., Tyers M. From large networks to small molecules. Curr. Opin. Chem. Biol. 2004;8:81–90. - PubMed

Publication types

MeSH terms

Substances