

Demonstration of a longitudinal concentration gradient along scala tympani by sequential sampling of perilymph from the cochlear apex
- PMID: 16718612
- PMCID: PMC1945159
- DOI: 10.1007/s10162-006-0034-y
Demonstration of a longitudinal concentration gradient along scala tympani by sequential sampling of perilymph from the cochlear apex
Abstract
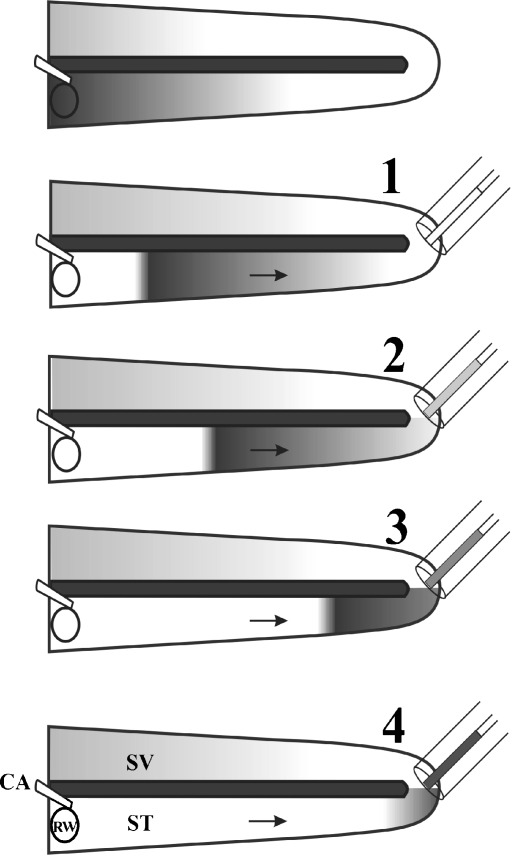
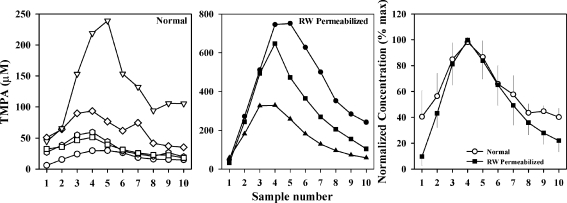
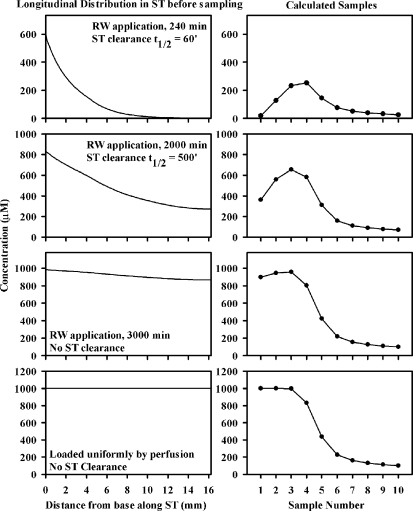
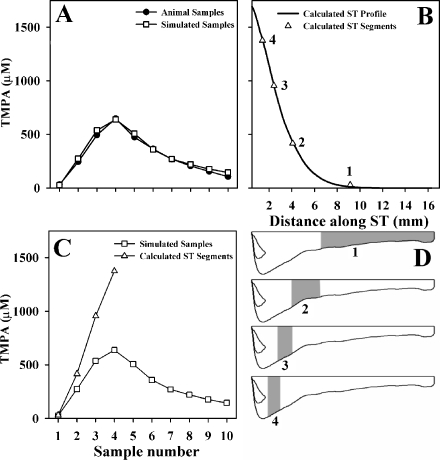
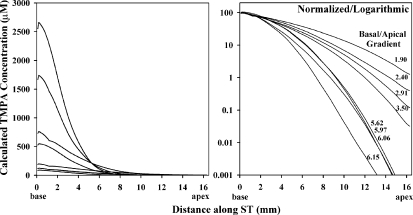
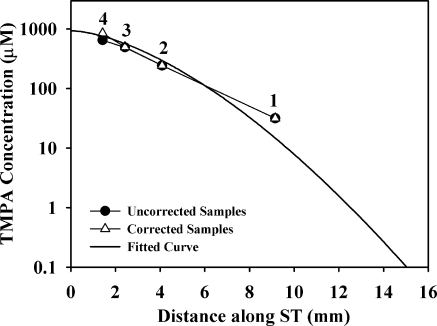
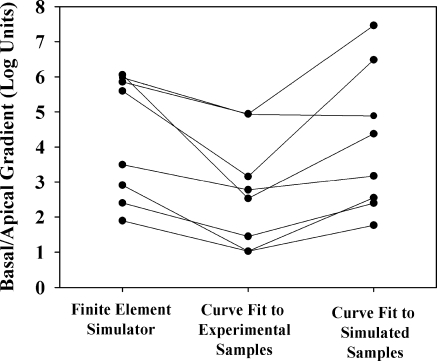
Local applications of drugs to the inner ear are increasingly being used to treat patients' inner ear disorders. Knowledge of the pharmacokinetics of drugs in the inner ear fluids is essential for a scientific basis for such treatments. When auditory function is of primary interest, the drug's kinetics in scala tympani (ST) must be established. Measurement of drug levels in ST is technically difficult because of the known contamination of perilymph samples taken from the basal cochlear turn with cerebrospinal fluid (CSF). Recently, we reported a technique in which perilymph was sampled from the cochlear apex to minimize the influence of CSF contamination (J. Neurosci. Methods, doi: 10.1016/j.jneumeth.2005.10.008 ). This technique has now been extended by taking smaller fluid samples sequentially from the cochlear apex, which can be used to quantify drug gradients along ST. The sampling and analysis methods were evaluated using an ionic marker, trimethylphenylammonium (TMPA), that was applied to the round window membrane. After loading perilymph with TMPA, 10 1-muL samples were taken from the cochlear apex. The TMPA content of the samples was consistent with the first sample containing perilymph from apical regions and the fourth or fifth sample containing perilymph from the basal turn. TMPA concentration decreased in subsequent samples, as they increasingly contained CSF that had passed through ST. Sample concentration curves were interpreted quantitatively by simulation of the experiment with a finite element model and by an automated curve-fitting method by which the apical-basal gradient was estimated. The study demonstrates that sequential apical sampling provides drug gradient data for ST perilymph while avoiding the major distortions of sample composition associated with basal turn sampling. The method can be used for any substance for which a sensitive assay is available and is therefore of high relevance for the development of preclinical and clinical strategies for local drug delivery to the inner ear.
Figures
References
-
- {'text': '', 'ref_index': 1, 'ids': [{'type': 'DOI', 'value': '10.1016/j.jconrel.2005.09.003', 'is_inner': False, 'url': 'https://doi.org/10.1016/j.jconrel.2005.09.003'}, {'type': 'PMC', 'value': 'PMC2030590', 'is_inner': False, 'url': 'https://pmc.ncbi.nlm.nih.gov/articles/PMC2030590/'}, {'type': 'PubMed', 'value': '16274830', 'is_inner': True, 'url': 'https://pubmed.ncbi.nlm.nih.gov/16274830/'}]}
- Chen Z, Kujawa SG, McKenna MJ, Fiering JO, Mescher MJ, Borenstein JT, Leary Swan EE, Sewell WF (2005) Inner ear drug delivery via a reciprocating perfusion system in the guinea pig. J. Control. Release 110:1–19. - PMC - PubMed
-
- {'text': '', 'ref_index': 1, 'ids': [{'type': 'DOI', 'value': '10.1016/S0378-5955(01)00375-6', 'is_inner': False, 'url': 'https://doi.org/10.1016/s0378-5955(01)00375-6'}, {'type': 'PubMed', 'value': '11707357', 'is_inner': True, 'url': 'https://pubmed.ncbi.nlm.nih.gov/11707357/'}]}
- Ghiz AF, Salt AN, DeMott JE, Henson MM, Henson OW Jr, Gewalt SL (2001) Quantitative anatomy of the round window and cochlear aqueduct in guinea pigs. Hear Res. 162:105–112. - PubMed
-
- {'text': '', 'ref_index': 1, 'ids': [{'type': 'DOI', 'value': '10.1016/0378-5955(89)90150-0', 'is_inner': False, 'url': 'https://doi.org/10.1016/0378-5955(89)90150-0'}, {'type': 'PubMed', 'value': '2606807', 'is_inner': True, 'url': 'https://pubmed.ncbi.nlm.nih.gov/2606807/'}]}
- Hara A, Salt AN, Thalmann R (1989) Perilymph composition in scala tympani of the cochlea: influence of cerebrospinal fluid. Hear Res. 42:265–271. - PubMed
-
- {'text': '', 'ref_index': 1, 'ids': [{'type': 'PubMed', 'value': '9386250', 'is_inner': True, 'url': 'https://pubmed.ncbi.nlm.nih.gov/9386250/'}]}
- Hoffer ME, Balough B, Henderson J, DeCicco M, Wester D, O'Leary MJ, Kopke R (1997) Use of sustained release vehicles in the treatment of Meniere's disease. Otolaryngol. Clin. North Am. 30:1159–1166. - PubMed
-
- {'text': '', 'ref_index': 1, 'ids': [{'type': 'DOI', 'value': '10.1016/S1359-6446(05)03595-6', 'is_inner': False, 'url': 'https://doi.org/10.1016/s1359-6446(05)03595-6'}, {'type': 'PubMed', 'value': '16214671', 'is_inner': True, 'url': 'https://pubmed.ncbi.nlm.nih.gov/16214671/'}]}
- Holley MC (2005) The auditory system, hearing loss and potential targets for drug development. Drug Discov. Today 10:1269–1282. - PubMed
Publication types
MeSH terms
Substances
Grants and funding
LinkOut - more resources
Full Text Sources
Other Literature Sources
Miscellaneous
