Review
. 2006 May 21;12(19):2969-78.
doi: 10.3748/wjg.v12.i19.2969.

Current and future applications of magnetic resonance imaging and spectroscopy of the brain in hepatic encephalopathy

Affiliations
Review

Current and future applications of magnetic resonance imaging and spectroscopy of the brain in hepatic encephalopathy

V-P Bob Grover et al. World J Gastroenterol. .

Abstract

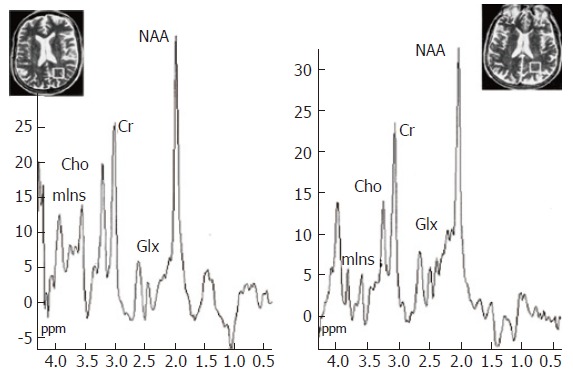
Hepatic encephalopathy (HE) is a common neuro-psychiatric abnormality, which complicates the course of patients with liver disease and results from hepatocellular failure and/or portosystemic shunting. The manifestations of HE are widely variable and involve a spectrum from mild subclinical disturbance to deep coma. Research interest has focused on the role of circulating gut-derived toxins, particularly ammonia, the development of brain swelling and changes in cerebral neurotransmitter systems that lead to global CNS depression and disordered function. Until recently the direct investigation of cerebral function has been difficult in man. However, new magnetic resonance imaging (MRI) techniques provide a non-invasive means of assessment of changes in brain volume (coregistered MRI) and impaired brain function (fMRI), while proton magnetic resonance spectroscopy (1H MRS) detects changes in brain biochemistry, including direct measurement of cerebral osmolytes, such as myoinositol, glutamate and glutamine which govern processes intrinsic to cellular homeostasis, including the accumulation of intracellular water. The concentrations of these intracellular osmolytes alter with hyperammonaemia. MRS-detected metabolite abnormalities correlate with the severity of neuropsychiatric impairment and since MR spectra return towards normal after treatment, the technique may be of use in objective patient monitoring and in assessing the effectiveness of various treatment regimens.


Figures

Figure 1
Figure 1
T1-weighted brain MR image through the basal ganglia acquired at 1.5T, showing bilateral globus pallidus (arrow) hyperintensity in a patient with cirrhosis of the liver.
Figure 2
Figure 2
Model demonstrating the concepts underlying the phenomenon of magnetization transfer. The free pool of protons (A) resonates at the Larmor frequency (ν0) and has a narrow spectral line. It is excited by an RF pulse which covers the frequencies shown in pink. The “bound” pool of protons (B) has a broad spectral line and can be excited and saturated by the application of RF irradiation at a frequency offset by Δν, shown in blue, without significantly affecting pool A.
Figure 3
Figure 3
Principles of diffusion: A water molecule in an unconstrained environment would move randomly and equally in all directions; isotropic diffusion (A). The probability of motion can be defined by the radius ‘r’, of the spherical range of motion. Diffusion in an ordered environment such as the white matter will assume an elliptical range of motion (B and C). Three eigenvalues, λ1, λ2 and λ3 define the shape and three eigenvectors v1, v2 and v3 define the orientation of the ellipsoid.
Figure 4
Figure 4
Color fractional anisotropy (FA) image from a 44 year-old healthy male volunteer. Diffusion tensor imaging (DTI) performed on a 3T Philips InteraTM using 32 different directions of diffusion sensitization. The different colors represent the principle diffusion directions and hence the direction of the white matter tracts: green represents anterior-posterior, blue represents caudo-cranial, red represents transverse. FA maps were generated using DTI studio version 2.1©, (Jiang and Mori, Johns Hopkins University, MD, USA).
Figure 5
Figure 5
1H MR spectroscopy water-suppressed proton spectra of an 8 mL voxel located in the parietal region including predominantly normal appearing white matter (insert images show position of the voxel) in a healthy control subject (left) and in a cirrhotic patient (right), acquired using a STEAM pulse sequence [1600/20/30/256 (TR/TE/TM/acquisitions)]. The main resonances correspond to N-acetylaspartate (NAA, 2.0 ppm), glutamate/glutamine (Glx, 2.1-2.5 ppm), creatine/phosphocreatine (Cr, 3.02 ppm), choline-containing compounds (Cho, 3.2 ppm), and myo-Inositol (mIns, 3.55 ppm). Comparison of the spectra shows a decrease in Cho and mIns resonances with an increase in the glutamate/glutamine region in the cirrhotic patient. Reproduced with the permission of Springer Science and Business Media, from Cordoba et al 2002[28].
Figure 6
Figure 6
Normal brain phosphorus-31 MR spectrum acquired at 1.5T. PME = phosphomonoesters, Pi=inorganic phosphate, PDE = phosphodiesters, PCr = phosphocreatine, NTP = nucleotide triphosphate. The PME resonance provides information on cell membrane precursors and the PDE resonance on cell membrane degradation products.
Figure 7
Figure 7
A localized two-dimensional correlated spectroscopy (two-dimensional L-COSY) spectrum of a 40-year-old patient. A projected one-dimensional spectrum is also shown on top of the figure. Peaks are presented in the magnitude mode. Reproduced with permission from John Wiley and Sons Inc, from Binesh N et al 2005[92].

References

    1. Ferenci P, Lockwood A, Mullen K, Tarter R, Weissenborn K, Blei AT. Hepatic encephalopathy--definition, nomenclature, diagnosis, and quantification: final report of the working party at the 11th World Congresses of Gastroenterology, Vienna, 1998. Hepatology. 2002;35:716–721. - PubMed
    1. Conn HO. Diuresis of ascites: fraught with or free from hazard. Gastroenterology. 1977;73:619–621. - PubMed
    1. Butterworth RF, Giguère JF, Michaud J, Lavoie J, Layrargues GP. Ammonia: key factor in the pathogenesis of hepatic encephalopathy. Neurochem Pathol. 1987;6:1–12. - PubMed
    1. Schenker S, Brady CE. Pathogenesis of hepatic encephalopathy. In: Conn , HO , Bircher , J , editors. Hepatic Encephalopathy: Syndromes and Therapies. Bloomington: Medi-Ed Press; 1994. pp. 43–61.
    1. Häussinger D, Kircheis G, Fischer R, Schliess F, vom Dahl S. Hepatic encephalopathy in chronic liver disease: a clinical manifestation of astrocyte swelling and low-grade cerebral edema. J Hepatol. 2000;32:1035–1038. - PubMed

Publication types