

Functional oesophago-gastric junction imaging
- PMID: 16718804
- PMCID: PMC4087796
- DOI: 10.3748/wjg.v12.i18.2818
Functional oesophago-gastric junction imaging
Abstract
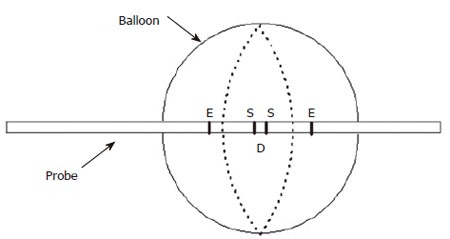
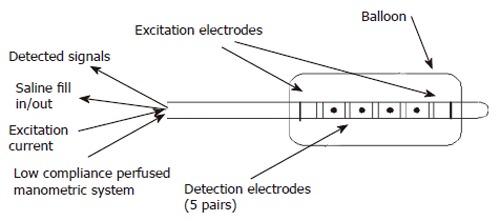
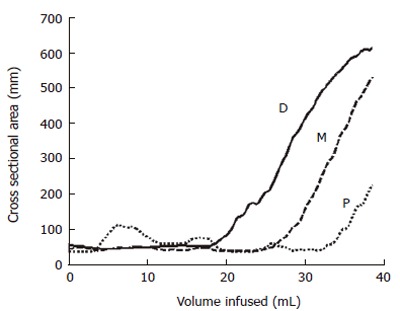
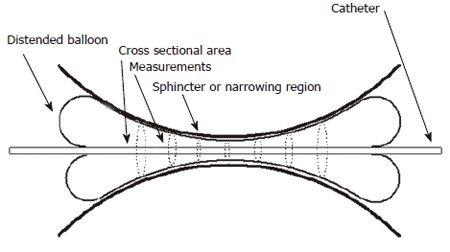
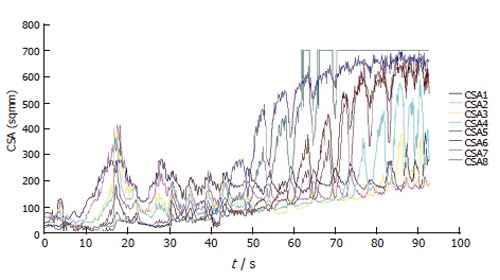
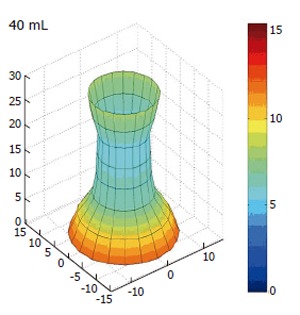
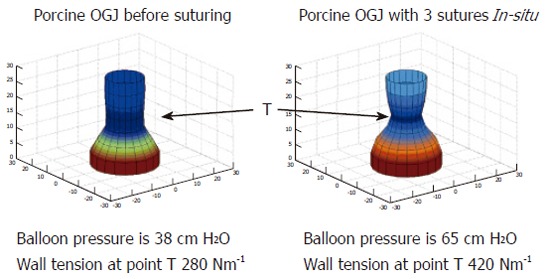
Despite its role in disease there is still no definitive method to assess oesophago-gastric junction competence (OGJ). Traditionally the OGJ has been assessed using manometry with lower oesophageal sphincter pressure as the indicator. More recently this has been shown not to be a very reliable marker of sphincter function and competence against reflux. Disorders such as gastro-oesophageal reflux disease and to a lesser extend achalasia still effects a significant number of patients. This review looks at using a new technique known as impedance planimetry to profile the geometry and pressure in the OGJ during distension of a bag. The data gathered can be reconstructed into a dynamic representation of OGJ action. This has been shown to provide a useful representation of the OGJ and to show changes to the competence of the OGJ in terms of compliance and distensibility as a result of endoluminal therapy.
Figures
References
-
- Liebermann-Meffert D. What anatomic structures are undoubtedly responsible for gastroesophageal competence. In: Guili R, Galmiche J, Jamieson G, Scarpignato C, eds , et al., editors. The esophagogastric junction. London: John Libbey Eurotext; 1998. pp. 3–6.
-
- Goyal RK, Prasad M, Chang HY. Functional anatomy and physiology of swallowing and esophageal motility. In: The Esophagus, et al., editors. Castell DO, Richter JE eds. Philadelphia: Lippincott Williams & Wilkins; 2004. pp. 1–36.
-
- Boyle JT, Altschuler SM, Nixon TE, Tuchman DN, Pack AI, Cohen S. Role of the diaphragm in the genesis of lower esophageal sphincter pressure in the cat. Gastroenterology. 1985;88:723–730. - PubMed
-
- Liebermann-Meffert D, Allgöwer M, Schmid P, Blum AL. Muscular equivalent of the lower esophageal sphincter. Gastroenterology. 1979;76:31–38. - PubMed
-
- Mittal RK, Balaban DH. The esophagogastric junction. N Engl J Med. 1997;336:924–932. - PubMed
Publication types
MeSH terms
LinkOut - more resources
Full Text Sources
Medical
