. 2006 May 31;128(21):6885-92.
doi: 10.1021/ja0582105.

Ultrafast dynamics in DNA: "fraying" at the end of the helix

Affiliations

Ultrafast dynamics in DNA: "fraying" at the end of the helix

Daniele Andreatta et al. J Am Chem Soc. .

Abstract

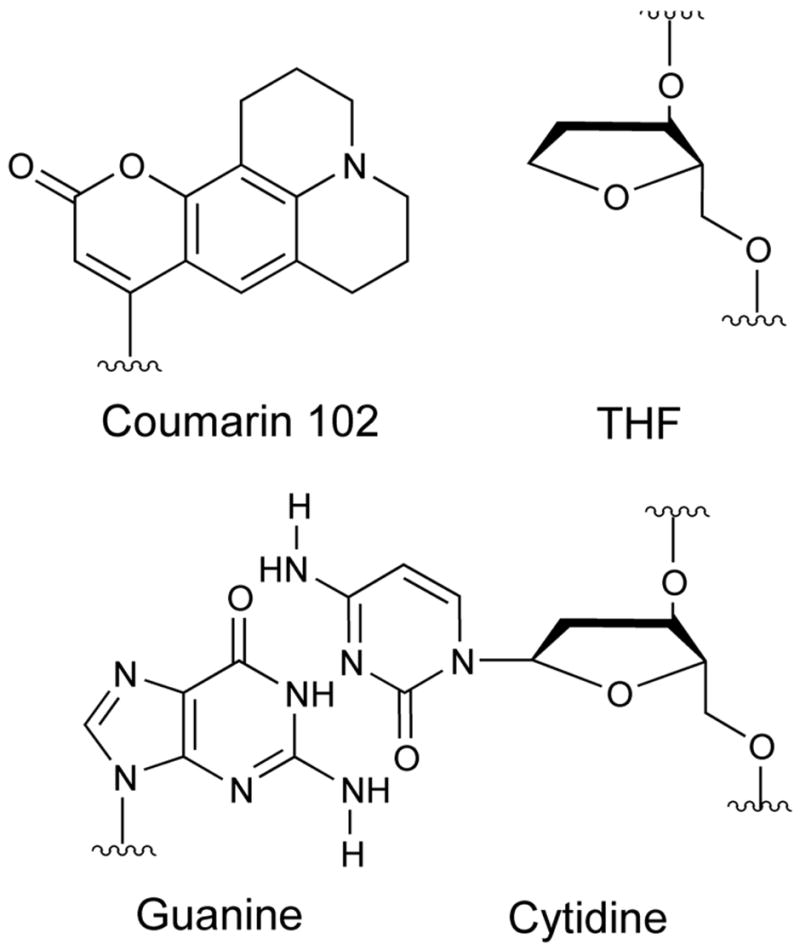
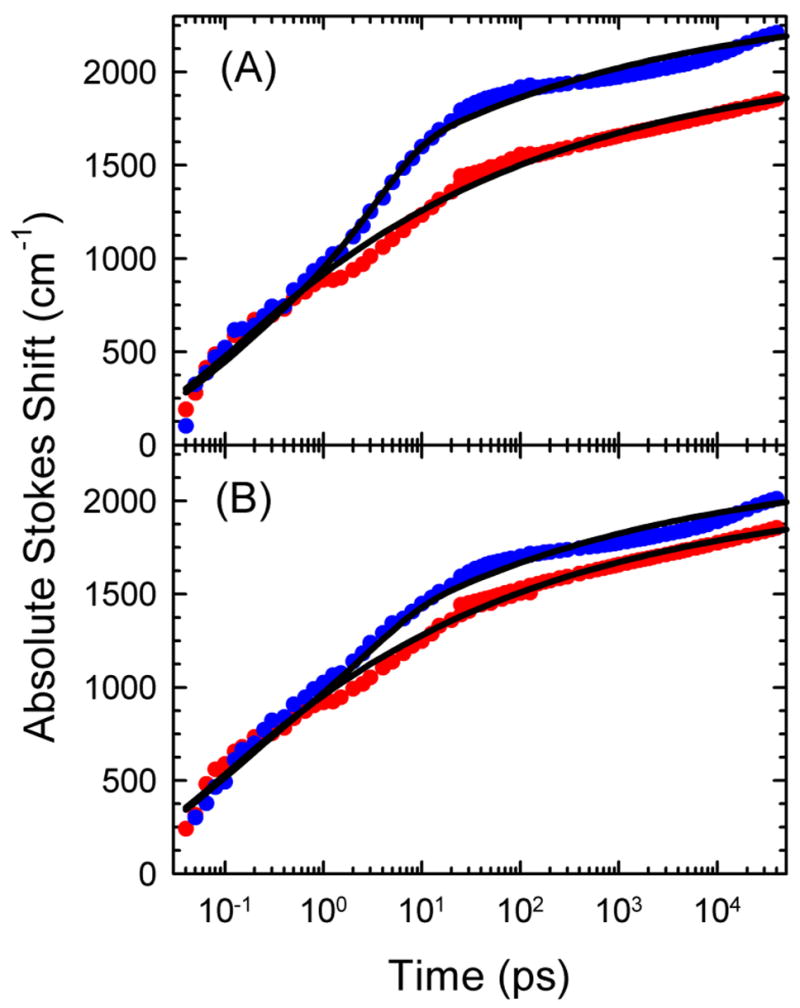
The dynamics of the electric fields in the interior of DNA are measured by using oligonucleotides in which a native base pair is replaced by a dye molecule (coumarin 102) whose emission spectrum is sensitive to the local electric field. Time-resolved measurements of the emission spectrum have been extended to a six decade time range (40 fs to 40 ns) by combining results from time-correlated photon counting, fluorescence up-conversion, and transient absorption. Recent results showed that when the reporter is placed in the center of the oligonucleotide, the dynamics are very broadly distributed over this entire time range and do not show specific time constants associated with individual processes (Andreatta, D.; et al. J. Am. Chem. Soc. 2005, 127, 7270). This paper examines an oligonucleotide with the reporter near its end. The broadly distributed relaxation seen before remains with little attenuation. In addition, a new relaxation with a well-defined relaxation time of 5 ps appears. This process is assigned to the rapid component of "fraying" at the end of the helix.


Figures

Figure 1
Figure 1
Structures of a native guanine:cytidine base pair (bottom) and of the coumarin:THF base-pair replacement used as a TRSS probe (top).
Figure 2
Figure 2
Steady-state excitation (right), emission at room temperature (left) and emission in a glass (middle) for the centered (black) and helix-end (red) sequences. The differences between the steady-state spectra of the two sequences are small. Normalized to unit area.
Figure 3
Figure 3
Examples of time-correlated single-photon counting data. Fluorescence decays on the high frequency (blue: 460 nm = 21 740 cm−1) and low frequency (red: 560 nm = 17 860 cm−1) sides of the emission spectrum and the instrument response function (IRF, green) are shown. The decays differ due to the TRSS effect. This effect is clearly present at these long times and can be followed accurately out to several times the fluorescence lifetime. These data are from the centered sequence.
Figure 4
Figure 4
(A) Typical transient-absorption spectra at various times show large changes at early times. (B) The individual components making up the transient-absorption spectrum at 65 ps: stimulated emission, ground-state bleach and excited-state absorption. The Stokes shift of the stimulated emission dominates the changes in the transient-absorption spectra with time. These data are from the centered sequence. Each spectrum has been normalized to unit area.
Figure 5
Figure 5
Excited-state absorption spectrum assuming various values of κ, the strength of the excited-state absorption relative to the strength of the ground-state absorption. The value κ = 1.45 gives the most reasonable spectral shape and is used in the rest of the analysis. The spectra are normalized to unit area. These data are from the centered sequence at 65 ps. The region near the pump frequency (25 000 cm−1) is perturbed by scattered light and has been left blank.
Figure 6
Figure 6
Examples of fluorescence up-conversion data (points) on the high frequency (blue: 470 nm = 21 280 cm−1) and low frequency (red: 540 nm = 18 520 cm−1) sides of the emission spectrum are quite different, indicating a pronounced Stokes shift at intermediate times. The stimulated-emission decays extracted from transient-absorption data (lines) do not agree well if shifting of the excited-state absorption spectrum is ignored (α = 0, dashed), but do agree if this shift is accounted for (α = 1, solid). These data are from the centered sequence.
Figure 7
Figure 7
Time-resolved spectra from various techniques show Stokes shifting over the entire time range from 40 fs to 40 ns. The steady-state spectrum in the glass (dashed curve) is used as an estimate of the 0 fs limit of the spectral shift. The spectra are from transient absorption (solid) at 40 fs, 150 fs, 4 ps and 100 ps, from fluorescence up-conversion (circles) at 4 ps and 100 ps and from time-correlated single-photon counting at 100 ps (squares) and 40 ns (solid). The data shown are from the centered sequence with α = 0.5.
Figure 8
Figure 8
Combined TRSS results from time-correlated single-photon counting (blue points), fluorescence up-conversion (green points) and transient absorption (red points). The lower set of points is fit (black curve) to a power law (eq 3). The upper set of points has been shifted vertically by 300 cm−1 and fit to a sum of four exponentials. The data shown are from the centered sequence with α = 0.5.
Figure 9
Figure 9
Comparison of TRSS results from the centered sequence (red) and the helix-end sequence (blue) and fits (black) to eq 5. Results are shown for two possible values for the relative magnitude of the excited-state absorption shift: (A) α = 1 and (B) α = 0.5. In (B), the helix-end data have been shifted vertically by +200 cm−1. There is no shift between the data sets in (A).

Similar articles

Cited by

References

    1. Leroy JL, Kochoyan M, Huynhdinh T, Guéron M. J Mol Biol. 1988;200:223. - PubMed
    1. Nonin S, Leroy JL, Guéron M. Biochemistry. 1995;34:10652. - PubMed
    1. Holbrook SR, Kim SH. J Mol Biol. 1984;173:361. - PubMed
    1. Fujimoto BS, Willie ST, Reid BR, Schurr JM. J Mag Res B. 1995;106:64. - PubMed
    1. Borer PN, Laplante SR, Kumar A, Zanatta N, Martin A, Hakkinen A, Levy GC. Biochemistry. 1994;33:2441. - PubMed

Publication types