

The obligate human pathogen, Neisseria gonorrhoeae, is polyploid
- PMID: 16719561
- PMCID: PMC1470461
- DOI: 10.1371/journal.pbio.0040185
The obligate human pathogen, Neisseria gonorrhoeae, is polyploid
Abstract
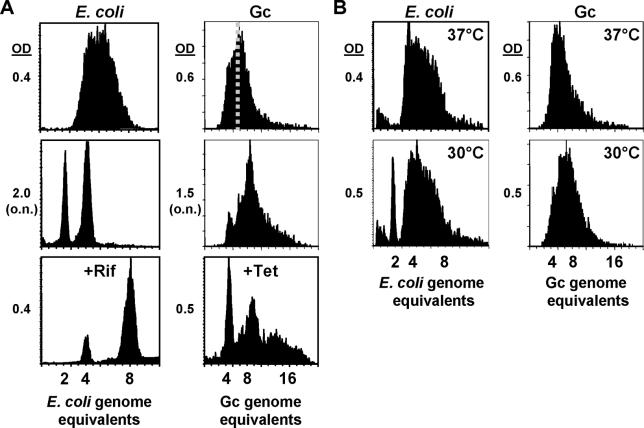
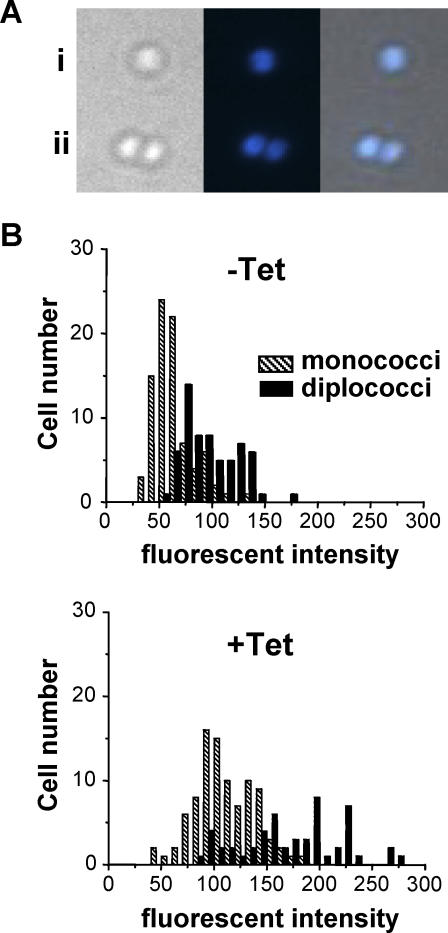
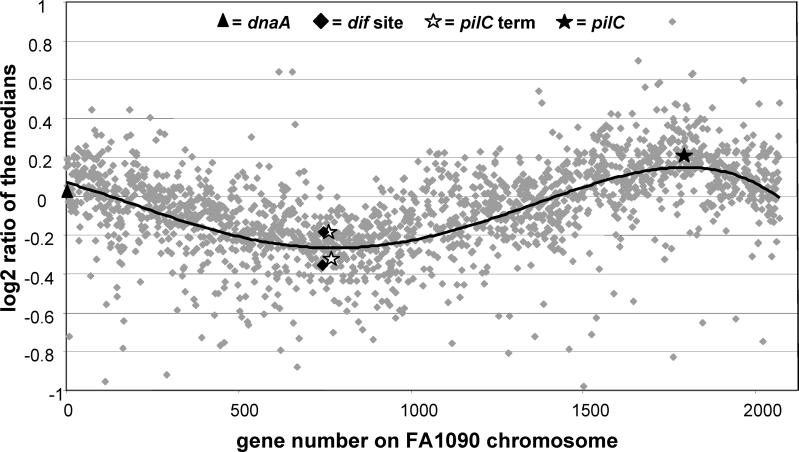
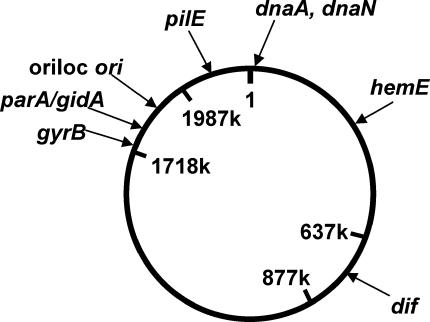
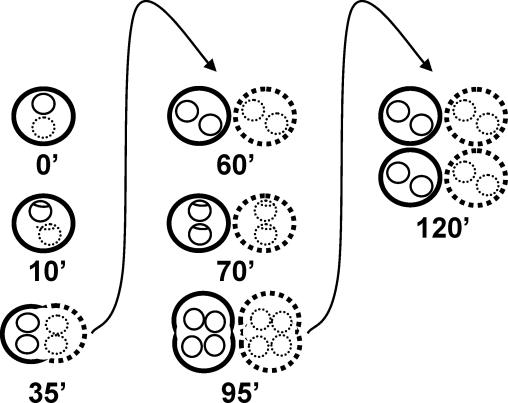
We show using several methodologies that the Gram-negative, diplococcal-bacterium Neisseria gonorrhoeae has more than one complete genome copy per cell. Gene dosage measurements demonstrated that only a single replication initiation event per chromosome occurs per round of cell division, and that there is a single origin of replication. The region containing the origin does not encode any genes previously associated with bacterial origins of replication. Quantitative PCR results showed that there are on average three genome copies per coccal cell unit. These findings allow a model for gonococcal DNA replication and cell division to be proposed, in which a minimum of two chromosomal copies exist per coccal unit within a monococcal or diplococcal cell, and these chromosomes replicate in unison to produce four chromosomal copies during cell division. Immune evasion via antigenic variation is an important mechanism that allows these organisms to continually infect a high risk population of people. We propose that polyploidy may be necessary for the high frequency gene conversion system that mediates pilin antigenic variation and the propagation of N. gonorrhoeae within its human hosts.
Figures
Comment in
-
The more the merrier: multiple genomes in a parasitic prokaryote.PLoS Biol. 2006 Jun;4(6):e212. doi: 10.1371/journal.pbio.0040212. Epub 2006 May 30. PLoS Biol. 2006. PMID: 20076595 Free PMC article. No abstract available.
References
-
- Helmstetter CE, Helmstetter CE. DNA synthesis during the division cycle of rapidly growing Escherichia coli. Br J Mol Biol. 1968;31:507–518. - PubMed
-
- Neidhardt FC. Cellular and molecular biology. Washington D.C.: ASM Press. pp; 1996. Escherichia coli and Salmonella typhimurium ; pp. 1579–1639.
-
- Steen HB, Boye E. Bacterial growth studied by flow cytometry. Cytometry. 1980;1:32–36. - PubMed
-
- Lemon KP, Moriya S, Ogasawara N, Grossman A. Chromosome replication and segregation. In: Sonenshein L, Hoch JA, Losick R, editors. Bacillus subtilis and its closest relatives: From genes to cells. Washington (D. C.): ASM Press; 2002. pp. 73–86.
Publication types
MeSH terms
Substances
Grants and funding
LinkOut - more resources
Full Text Sources
Other Literature Sources
