. 2006 Mar 20;7 Suppl 1(Suppl 1):S7.
doi: 10.1186/1471-2105-7-S1-S7.

ARACNE: an algorithm for the reconstruction of gene regulatory networks in a mammalian cellular context

Affiliations

ARACNE: an algorithm for the reconstruction of gene regulatory networks in a mammalian cellular context

Adam A Margolin et al. BMC Bioinformatics. .

Abstract

Background: Elucidating gene regulatory networks is crucial for understanding normal cell physiology and complex pathologic phenotypes. Existing computational methods for the genome-wide "reverse engineering" of such networks have been successful only for lower eukaryotes with simple genomes. Here we present ARACNE, a novel algorithm, using microarray expression profiles, specifically designed to scale up to the complexity of regulatory networks in mammalian cells, yet general enough to address a wider range of network deconvolution problems. This method uses an information theoretic approach to eliminate the majority of indirect interactions inferred by co-expression methods.

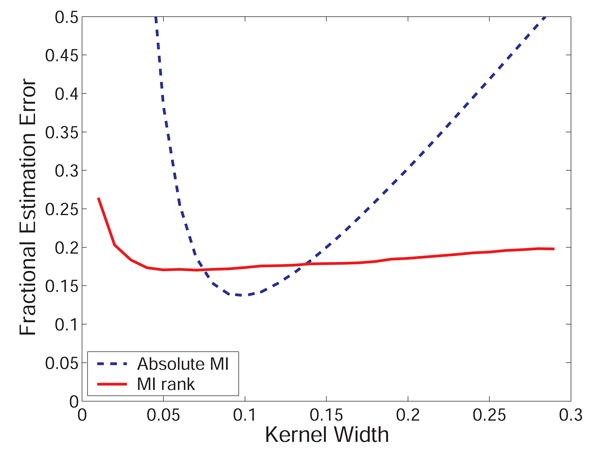
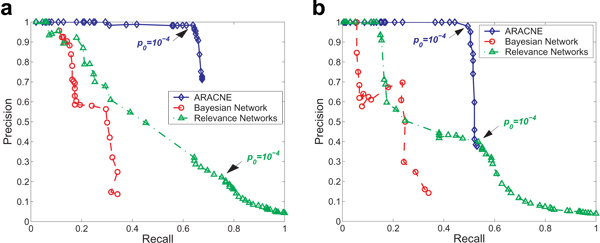
Results: We prove that ARACNE reconstructs the network exactly (asymptotically) if the effect of loops in the network topology is negligible, and we show that the algorithm works well in practice, even in the presence of numerous loops and complex topologies. We assess ARACNE's ability to reconstruct transcriptional regulatory networks using both a realistic synthetic dataset and a microarray dataset from human B cells. On synthetic datasets ARACNE achieves very low error rates and outperforms established methods, such as Relevance Networks and Bayesian Networks. Application to the deconvolution of genetic networks in human B cells demonstrates ARACNE's ability to infer validated transcriptional targets of the cMYC proto-oncogene. We also study the effects of misestimation of mutual information on network reconstruction, and show that algorithms based on mutual information ranking are more resilient to estimation errors.

Conclusion: ARACNE shows promise in identifying direct transcriptional interactions in mammalian cellular networks, a problem that has challenged existing reverse engineering algorithms. This approach should enhance our ability to use microarray data to elucidate functional mechanisms that underlie cellular processes and to identify molecular targets of pharmacological compounds in mammalian cellular networks.


Figures

Figure 1
Figure 1
MI and MI rank estimation errors for varying Gaussian kernel widths. The mean absolute percent error in estimating mutual information for bivariate normal densities is compared to the percent of errors in ranking the relative mutual information values for randomly sampled pairs for which the distribution with the lower true MI value is between 70% and 99% of the distribution with the higher value. MI estimation error (dashed blue line) is highly sensitive to the choice of Gaussian kernel width used by the estimator and grows rapidly for non-optimal parameter choices. However, due to similar bias for distributions with close MI values, the error in ranking pairs of MIs (solid red line) is much less sensitive to the choice of this parameter. These averages were produced using samples from 1,000 bivariate normal densities with a random uniformly distributed correlation coefficient ρ ∊ [0.1, 0.9], such that I¯=12log(1ρ2) MathType@MTEF@5@5@+=feaafiart1ev1aaatCvAUfKttLearuWrP9MDH5MBPbIqV92AaeXatLxBI9gBaebbnrfifHhDYfgasaacH8akY=wiFfYdH8Gipec8Eeeu0xXdbba9frFj0=OqFfea0dXdd9vqai=hGuQ8kuc9pgc9s8qqaq=dirpe0xb9q8qiLsFr0=vr0=vr0dc8meaabaqaciGacaGaaeqabaqabeGadaaakeaacuWGjbqsgaqeaiabg2da9iabgkHiTmaaliaabaGaeGymaedabaGaeGOmaidaaiGbcYgaSjabc+gaVjabcEgaNnaabmaabaGaeGymaeJaeyOeI0IaeqyWdi3aaWbaaSqabeaacqaIYaGmaaaakiaawIcacaGLPaaaaaa@3C35@. This results in a distribution of MI values that closely resembles that of the real microarray data.
Figure 2
Figure 2
Examples of the data processing inequality. (a) g1, g2, g3, and g4 are connected in a linear chain relationship. Although all six gene pairs will likely have enriched mutual information, the DPI will infer the most likely path of information flow. For example, g1 g3 will be eliminated because I(g1, g2) >I(g1, g3) and I(g2, g3) >I(g1, g3). g2 g4 will be eliminated because I(g2, g3) >I(g2, g4) and I(g3, g4) >I(g2, g4). g1 g4 will be eliminated in two ways: first, because I(g1, g2) >I(g1, g4) and I(g2, g4) >I(g1, g4), and then because I(g1, g3) >I(g1, g4) and I(g3, g4) >I(g1, g4). (b) If the underlying interactions form a tree (and MI can be measured without errors), ARACNE will reconstruct the network exactly by removing all false candidate interactions (dashed blue lines) and retaining all true interactions (solid black lines).
Figure 3
Figure 3
Topology of the 100 gene regulatory networks proposed by Mendes. Blue/red edges correspond to activation/inhibition. For the Erdös-Rényi topology (a) each gene is equally likely to be connected to every other gene, while the scale-free topology (b) is characterized by large interaction hubs with many connections.
Figure 4
Figure 4
Precision vs. Recall for 1,000 samples generated from the Mendes network. (a) Erdös-Rényi network topology. (b) Scale-free topology. ARACNE's PRCs are consistently better than those of the other algorithms, and the precision reaches ~100% while maintaining high recall. Points on the PRCs for ARACNE and RNs corresponding to p0 = 10-4 (the value yieding <0.5 expected false positives for 4,950 potential interactions) are indicated with arrows.
Figure 5
Figure 5
Distribution of mutual information for different lengths of the shortest path between genes for the scale-free topology. Here we plot the log of the empirical probability that MI for a given separation between genes is above some value (in nats) marked on the horizontal axis. High MI values are significantly more probable for closer genes. Statistical significance threshold of 10-4 for the background MI distribution, corresponding to I0 = 0.0175 nats, is marked on the graph. As shown, this threshold retains a large number of indirect candidate interactions, and there is no threshold that would be able to separate indirect and direct interactions; a threshold that eliminates most of the former (red arrows) also eliminates the majority of the latter. This severely degrades performance of RNs. (Inset) Expanded log-log view of the MI distribution for 934 gene pairs with 3 or more intermediaries and the background distribution computed by Monte Carlo. The curves are virtually indistinguishable, indicating that the background distribution can be used to obtain reliable estimates of statistical significance thresholds for filtering genes with higher degrees of connectivity. Similar results apply for the Erdös-Rényi topology (see additional file 3: MI distribution for different shortest path lengths for the Erdös-Rényi topology).
Figure 6
Figure 6
Synthetic network reconstruction errors for varying Gaussian kernel widths. The total number of inferred errors (NFP + NFN) in reconstructing the Mendes networks is stable with respect to choice of estimator kernel width, validating the observation that rankings of MIs are more stable than the MI estimates with respect to changes in this parameter (Figure 1). The choice of kernel width for each number of samples that minimizes the mean absolute MI estimation error for bivariate Gaussian densities (indicated with diamonds) yields optimal or near optimal reconstruction of this network for all samples sizes. Results are calculated for a statistical significance threshold of 10-4 for the scale-free network topology.

References

    1. Eisen MB, Spellman PT, Brown PO, Botstein D. Cluster analysis and display of genome-wide expression patterns. Proc Natl Acad Sci U S A. 1998;95:14863–14868. doi: 10.1073/pnas.95.25.14863. - DOI - PMC - PubMed
    1. Ma S-K. Statistical mechanics. Singapore: World Scientific; 1985.
    1. van Someren EP, Wessels LF, Backer E, Reinders MJ. Genetic network modeling. Pharmacogenomics. 2002;3:507–525. doi: 10.1517/14622416.3.4.507. - DOI - PubMed
    1. Friedman N. Inferring cellular networks using probabilistic graphical models. Science. 2004;303:799–805. doi: 10.1126/science.1094068. - DOI - PubMed
    1. Ideker T, Thorsson V, Ranish JA, Christmas R, Buhler J, Eng JK, Bumgarner R, Goodlett DR, Aebersold R, Hood L. Integrated genomic and proteomic analyses of a systematically perturbed metabolic network. Science. 2001;292:929–934. doi: 10.1126/science.292.5518.929. - DOI - PubMed

Publication types