. 2006 May 24;26(21):5709-19.
doi: 10.1523/JNEUROSCI.0802-06.2006.

Stress increases vulnerability to inflammation in the rat prefrontal cortex

Affiliations

Stress increases vulnerability to inflammation in the rat prefrontal cortex

R M de Pablos et al. J Neurosci. .

Abstract

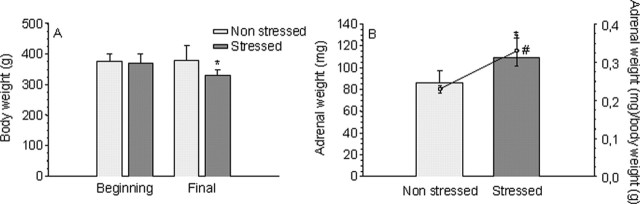
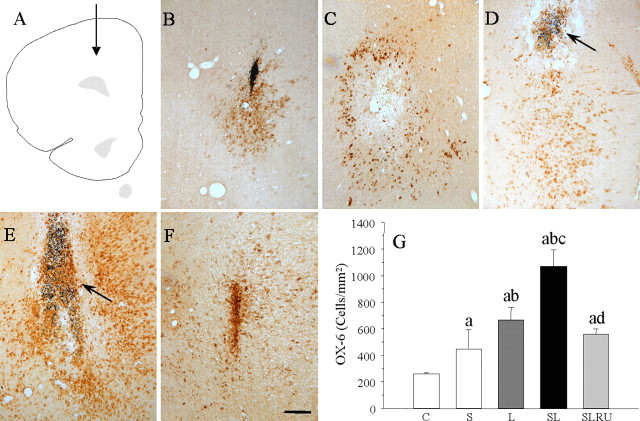
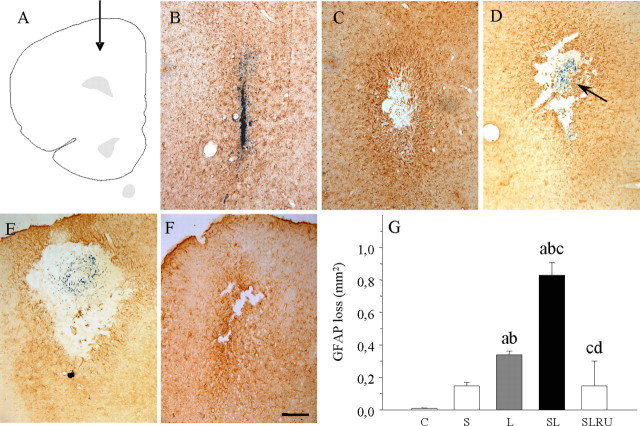
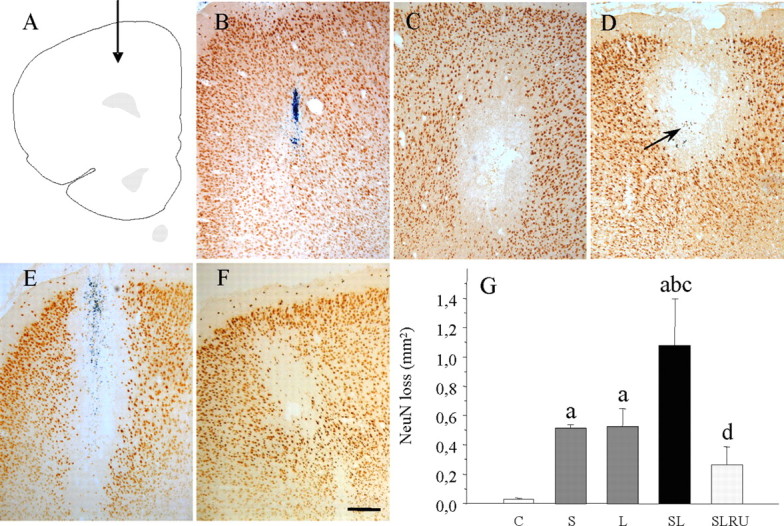
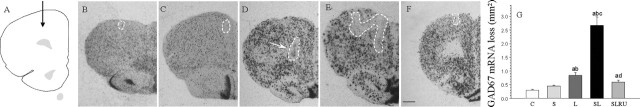
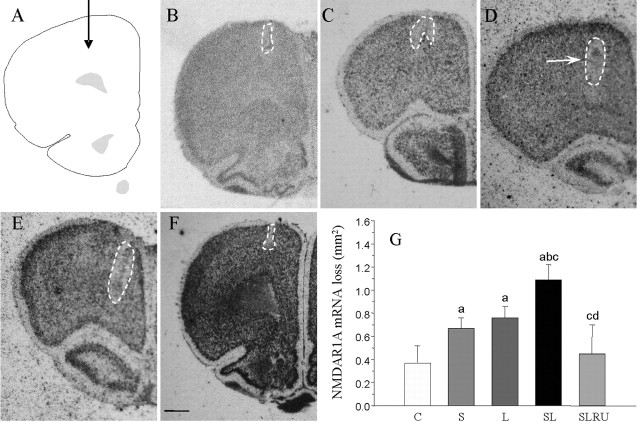
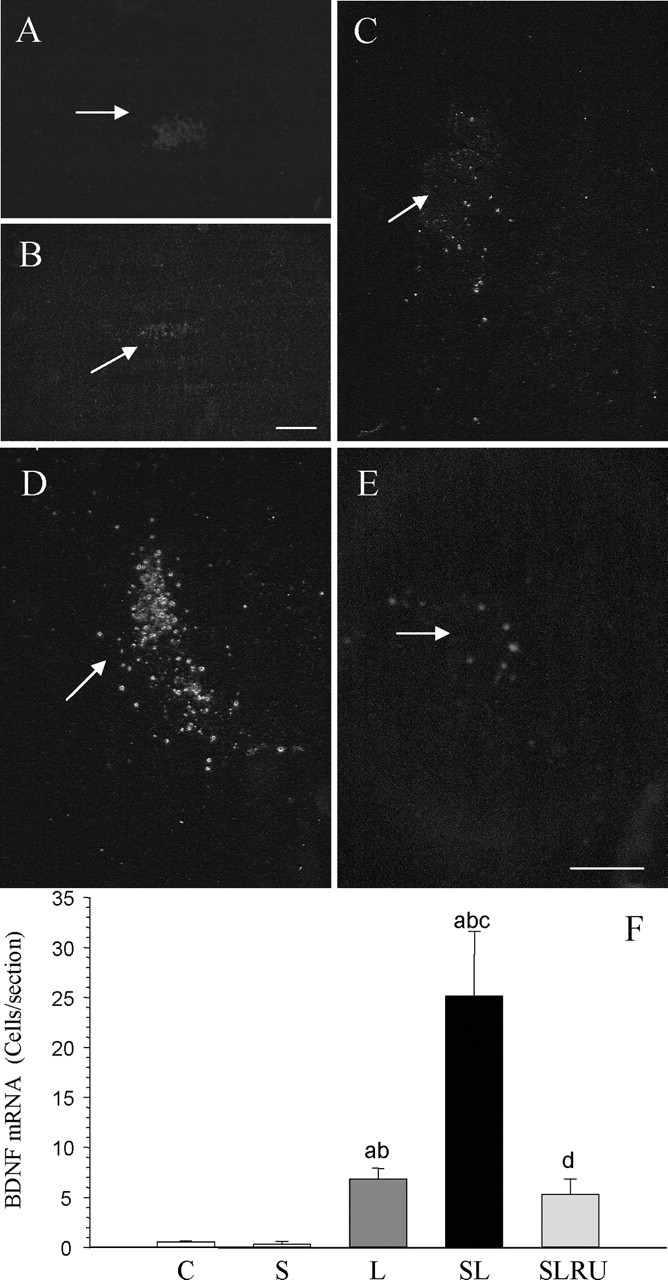
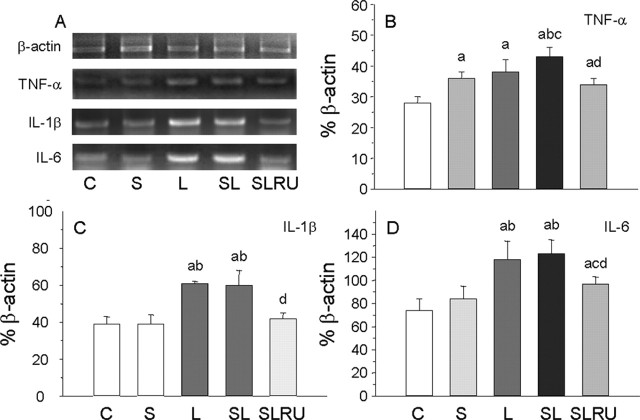
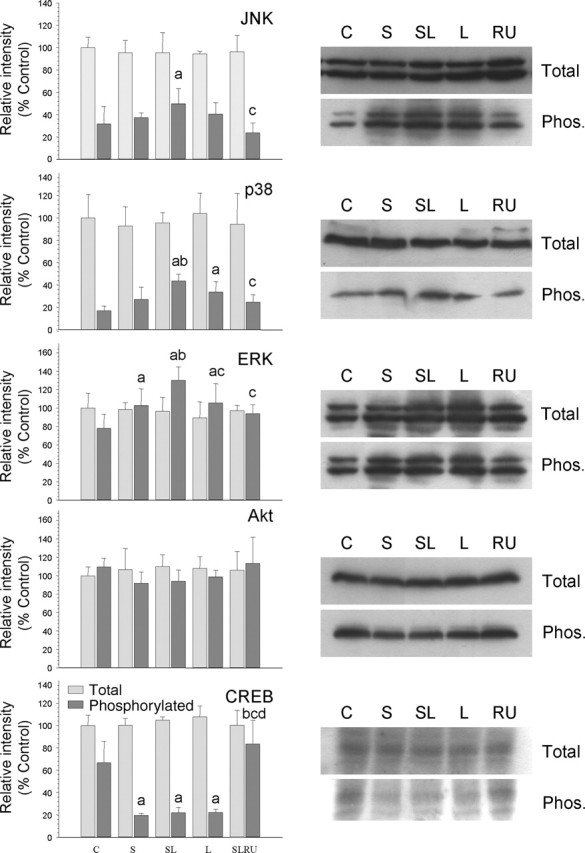
Inflammation could be involved in some neurodegenerative disorders that accompany signs of inflammation. However, because sensitivity to inflammation is not equal in all brain structures, a direct relationship is not clear. Our aim was to test whether some physiological circumstances, such as stress, could enhance susceptibility to inflammation in the prefrontal cortex (PFC), which shows a relative resistance to inflammation. PFC is important in many brain functions and is a target for some neurodegenerative diseases. We induced an inflammatory process by a single intracortical injection of 2 microg of lipopolysaccharide (LPS), a potent proinflammogen, in nonstressed and stressed rats. We evaluated the effect of our treatment on inflammatory markers, neuronal populations, BDNF expression, and behavior of several mitogen-activated protein (MAP) kinases and the transcription factor cAMP response element-binding protein. Stress strengthens the changes induced by LPS injection: microglial activation and proliferation with an increase in the levels of the proinflammatory cytokine tumor necrosis factor-alpha; loss of cells such as astroglia, seen as loss of glial fibrillary acidic protein immunoreactivity, and neurons, studied by neuronal-specific nuclear protein immunohistochemistry and GAD67 and NMDA receptor 1A mRNAs expression by in situ hybridization. A significant increase in the BDNF mRNA expression and modifications in the levels of MAP kinase phosphorylation were also found. In addition, we observed a protective effect from RU486 [mifepristone (11beta-[p-(dimethylamino)phenyl]-17beta-hydroxy-17-(1-propynyl)estra-4,9-dien-3-one)], a potent inhibitor of the glucocorticoid receptor activation. All of these data show a synergistic effect between inflammation and stress, which could explain the relationship described between stress and some neurodegenerative pathologies.


Figures

Figure 1.
Figure 1.
Effect of stress on the body and adrenal gland weights of LPS-injected animals. A, Body weight at the beginning and the end of the treatment of nonstressed and stressed animals. Results are expressed in grams and are the mean ± SD of five independent experiments. Statistical significance (Student’s t test) compared with the nonstressed rats: *p < 0.01. B, Adrenal weight (in milligrams; bars) and adrenal weight/body weight ratio (in milligrams per gram; circles) at the beginning and the end of the treatment of nonstressed and stressed animals. Results are mean ± SD of five independent experiments. Statistical significance (Student’s t test) compared with the nonstressed rats: #p < 0.05 for body weight; *p < 0.01 for the adrenal weight/body weight ratio.
Figure 2.
Figure 2.
Effect of stress and LPS in microglia. A, Schematic representation of the injections site in the prefrontal cortex. B, Coronal section showing a slight OX-6 immunoreactivity in a saline-injected nonstressed animal. C, OX-6 activation in a vehicle-injected stressed animal. D, Immunoreactivity in an LPS-injected nonstressed animal. The arrow points to the site of injection of 2 μg of LPS. Microglial reaction was mild. E, OX-6 immunoreactivity in an LPS-injected stressed animal. Microglial reaction is stronger and more widely distributed around the injection point (arrow). F, Treatment with RU486 reduces OX-6 activation in an LPS-injected stressed animal. Scale bar, 250 μm. G, Quantification of changes on the microglial population at the end of the treatments. Results are mean ± SD of four independent experiments and are expressed as positive cells per square millimeter. Statistical signification (one-way ANOVA, followed by the LSD post hoc test for multiple comparisons): a, compared with the control, vehicle-injected nonstressed animals; b, compared with the vehicle-injected stressed animals; c, compared with the LPS-injected nonstressed animals; d, compared with the LPS-injected stressed animals; p < 0.01. C, Control, vehicle injected in the PFC of nonstressed animals; S, vehicle injected in the PFC of stressed animals; L, LPS injected in the PFC of nonstressed animals; SL, LPS injected in the PFC of stressed animals; SLRU, stressed animals intracortically injected with LPS and treated with RU486.
Figure 3.
Figure 3.
Effect of stress and LPS in astroglia. A, Schematic representation of the injection sites in the prefrontal cortex. B, Coronal section showing GFAP immunoreactivity in a saline-injected nonstressed animal. Loss of astrocytes is restricted to the needle track. C, Loss of GFAP immunoreactivity in a vehicle-injected stressed animal. D, Coronal section showing GFAP immunoreactivity in an LPS-injected nonstressed animal. The arrow points to the site of injection of 2 μg of LPS. GFAP expression was more intense around the area lacking immunoreactivity. E, GFAP immunoreactivity in an LPS-injected stressed animal. The area lacking immunostaining is clearly larger. F, RU486 prevented the loss of astrocytes in an LPS-injected stressed animal. Scale bar, 250 μm. G, Quantification of the areas losing GFAP immunostaining. Results are mean ± SD of four independent experiments and are expressed as square millimeters. Statistical significance (one-way ANOVA, followed by the LSD post hoc test for multiple comparisons): a, compared with the control, vehicle-injected nonstressed animals; b, compared with the vehicle-injected stressed animals; c, compared with the LPS-injected nonstressed animals; d, compared with the LPS-injected stressed animals; p < 0.01. C, Control, vehicle injected in the PFC of nonstressed animals; S, vehicle injected in the PFC of stressed animals; L, LPS injected in the PFC of nonstressed animals; SL, LPS injected in the PFC of stressed animals; SLRU, stressed animals intracortically injected with LPS and treated with RU486.
Figure 4.
Figure 4.
Effect of stress and LPS on cortical neurons. A, Schematic representation of the injection site into the prefrontal cortex. B, Coronal section showing NeuN immunoreactivity after the injection of vehicle in nonstressed animals. The loss was restricted to the injection track. C, NeuN immunoreactivity after the injection of vehicle in stressed animals. Stress causes an appreciable loss of cortical neurons. D, Coronal section showing NeuN immunoreactivity after the injection of 2 μg of LPS into the prefrontal cortex of nonstressed rats. Evenly distributed staining is disrupted around the injection site (arrow). E, NeuN immunoreactivity after the injection of 2 μg of LPS into the prefrontal cortex of stressed rats. The area lacking staining is larger. F, The treatment with RU486 highly diminished the loss of NeuN-positive neurons caused by the combined action of LPS and stress. Scale bar, 250 μm. G, Quantification of the areas losing NeuN immunostaining. Results are mean ± SD of four independent experiments and are expressed as square millimeters. Statistical significance (one-way ANOVA, followed by the LSD post hoc test for multiple comparisons): a, compared with the control, vehicle-injected nonstressed animals; b, compared with the vehicle-injected stressed animals; c, compared with the LPS-injected nonstressed animals; d, compared with the LPS-injected stressed animals; p < 0.01. C, Control, vehicle injected in the PFC of nonstressed animals; S, vehicle injected in the PFC of stressed animals; L, LPS injected in the PFC of nonstressed animals; SL, LPS injected in the PFC of stressed animals; SLRU, stressed animals intracortically injected with LPS and treated with RU486.
Figure 5.
Figure 5.
Effect of stress and LPS on cortical neurons expressing GAD67 mRNA. A, Schematic representation of the injection site into the prefrontal cortex. B, Coronal section showing GAD67 mRNA expression after the injection of vehicle in nonstressed animals. The loss can be seen closely around the injection track (dashed-lined area). C, GAD67 mRNA expression after the injection of vehicle in stressed animals. Stress causes a slight loss of cortical neurons (dashed-lined area). D, Coronal section showing GAD67 mRNA in situ hybridization after the injection of 2 μg of LPS into the prefrontal cortex of nonstressed rats. Normal expression is disrupted (dashed-lined area) around the injection site. Arrow shows the inert tracer. E, GAD67 mRNA expression after the injection of 2 μg of LPS into the prefrontal cortex of stressed rats. The area lacking staining (dashed-lined area) is larger. F, RU486 exerted a protective effect on the expression of GAD67 mRNA in stressed rats injected with LPS. Scale bar, 1 mm. G, Quantification of the areas losing GAD67 mRNA expression. Results are mean ± SD of five independent experiments and are expressed as square millimeters. Statistical significance (ANOVA, followed by the LSD post hoc test for multiple comparisons): a, compared with the control, vehicle-injected nonstressed animals; b, compared with the vehicle-injected stressed animals; c, compared with the LPS-injected nonstressed animals; d, compared with the LPS-injected stressed animals; p < 0.01. C, Control, vehicle injected in the PFC of nonstressed animals; S, vehicle injected in the PFC of stressed animals; L, LPS injected in the PFC of nonstressed animals; SL, LPS injected in the PFC of stressed animals; SLRU, stressed animals intracortically injected with LPS and treated with RU486.
Figure 6.
Figure 6.
Effect of stress and LPS on cortical neurons expressing NMDAR1A mRNA. A, Schematic representation of the injection site in the prefrontal cortex. B, Coronal section showing NMDAR1A mRNA expression after the injection of vehicle in nonstressed animals. The loss can be seen closely around the injection track (dashed-lined area). C, NMDAR1A mRNA expression after the injection of vehicle in stressed animals. Stress causes an appreciable loss of cortical neurons (dashed-lined area). D, NMDAR1A mRNA in situ hybridization after the injection of 2 μg of LPS into the prefrontal cortex of nonstressed rats. Evenly distributed expression is disrupted (dashed-lined area) around the injection site. Arrow shows the inert tracer. E, NMDAR1A mRNA expression after the injection of 2 μg of LPS into the prefrontal cortex of stressed rats. The area lacking expression (dashed-lined area) is larger. F, Loss of NMDAR1A mRNA expression induced by LPS and stress is reduced by the treatment with RU486. Scale bar, 1 mm. G, Quantification of the areas losing NMDAR1A mRNA expression. Results are mean ± SD of four independent experiments and are expressed as square millimeters. Statistical significance (one-way ANOVA, followed by the LSD post hoc test for multiple comparisons): a, compared with the control, vehicle-injected nonstressed animals; b, compared with the vehicle-injected stressed animals; c, compared with the LPS-injected nonstressed animals; d, compared with the LPS-injected stressed animals; p < 0.01. C, Control, vehicle injected in the PFC of nonstressed animals; S, vehicle injected in the PFC of stressed animals; L, LPS injected in the PFC of nonstressed animals; SL, LPS injected in the PFC of stressed animals; SLRU, stressed animals intracortically injected with LPS and treated with RU486.
Figure 7.
Figure 7.
Effect of stress and LPS on BDNF mRNA expression in the prefrontal cortex. Dark-field photographs were taken from emulsion-dipped slide sections. A, BDNF mRNA expression after the injection of 2 μl of vehicle in the prefrontal cortex of nonstressed rats. Virtually no cells are detectable around the injection site (arrow). B, BDNF mRNA expression after the injection of 2 μl of vehicle into the prefrontal cortex of stressed rats. Cells are absent around the injection track. C, BDNF mRNA expression after the injection of 2 μg of LPS into the prefrontal cortex of nonstressed rats. A few cells can be seen around the injection site (arrow). D, BDNF mRNA expression after the injection of 2 μg of LPS into the prefrontal cortex of stressed rats. The number of cells around the injection site (arrow) has increased. E, The increase in BDNF mRNA expression induced by LPS and stress is diminished by the treatment with RU486. Scale bars, 250 μm. F, Quantification of the BDNF mRNA expression. Results are mean ± SD of four independent experiments and are expressed as cells per section. Statistical significance (one-way ANOVA, followed by the LSD post hoc test for multiple comparisons): a, compared with the control, vehicle-injected nonstressed animals; b, compared with the vehicle-injected stressed animals; c, compared with the LPS-injected nonstressed animals; d, compared with the LPS-injected stressed animals; p < 0.01. C, Control, vehicle injected in the PFC of nonstressed animals; S, vehicle injected in the PFC of stressed animals; L, LPS injected in the PFC of nonstressed animals; SL, LPS injected in the PFC of stressed animals; SLRU, stressed animals intracortically injected with LPS and treated with RU486.
Figure 8.
Figure 8.
Effect of stress and LPS on the expression levels of TNF-α, IL-1β, and IL-6 mRNAs. Expression of TNF-α, IL-1β, and IL-6 mRNAs were measured by RT-PCR in the prefrontal cortex of rats from the different treatments assayed: C, control, vehicle injected in the PFC of nonstressed animals; S, vehicle injected in the PFC of stressed animals; L, LPS injected in the PFC of nonstressed animals; SL, LPS injected in the PFC of stressed animals; SLRU, stressed animals intracortically injected with LPS and treated with RU486. A, Photographs from agarose gels showing expression of mRNAs 6 h after injection of either vehicle or LPS into the left PFC. β-Actin mRNA expression served as control. B, Quantification of TNF-α mRNA expression. Stress and LPS increased expression levels in a similar way. TNF-α mRNA induction was higher when LPS and stress were combined. RU486 diminished expression levels. C, Quantification of IL-1β mRNA expression. Stress had no effect, whereas induction of IL-1β levels attributable to LPS injection was similar in nonstressed and stressed animals. RU486 reduced IL-1β levels to control values. D, Quantification of IL-6 mRNA expression. Similar to IL-1β, stress had no effect on IL-6 mRNA expression levels, and the increase induced by LPS was reduced by RU486. Results are mean ± SD of four independent experiments and are expressed as percentage of β-actin mRNA expression. Statistical significance (one-way ANOVA, followed by the LSD post hoc test for multiple comparisons): a, compared with the control, vehicle-injected nonstressed animals; b, compared with the vehicle-injected stressed animals; c, compared with the LPS-injected nonstressed animals; d, compared with the LPS-injected stressed animals; p < 0.01.
Figure 9.
Figure 9.
Effect of LPS and stress on several kinases and the transcription factor CREB in the prefrontal cortex. Proteins from the cortex of rats from the different treatments assayed (C, control, vehicle injected in the PFC of nonstressed animals; S, vehicle injected in the PFC of stressed animals; SL, LPS injected in the PFC of stressed animals; L, LPS injected in the PFC of nonstressed animals; RU, stressed animals intracortically injected with LPS and treated with RU486) were separated by electrophoresis, transferred to nitrocellulose membranes, and stained using anti-JNK, anti P-JNK, anti-p38, anti-P-p38, anti-ERK, anti-P-ERK, anti-Akt, anti-P-Akt, anti-CREB, and anti-P-CREB antibodies. Total optical density of each band was calculated. Results are mean ± SD of four independent experiments and are expressed as relative intensity of control bands. Statistical significance (one-way ANOVA, followed by the LSD post hoc test for multiple comparisons): a, compared with the control, vehicle-injected nonstressed animals; b, compared with the vehicle-injected stressed animals; c, compared with the LPS-injected stressed animal; d, compared with the LPS-injected nonstressed animals; p < 0.01.

References

    1. Abekawa T, Ohmori T, Ito K, Koyama T (2000). D1 dopamine receptor activation reduces extracellular glutamate and GABA concentrations in the medial prefrontal cortex. Brain Res 867:250–254. - PubMed
    1. Akiyama H, Barger S, Barnum S, Bradt B, Bauer J, Cole GM, Cooper NR, Eikelenboom P, Emmerling M, Fiebich BL, Finch CE, Frautschy S, Griffin WS, Hampel H, Hull M, Landreth G, Lue L, Mrak R, Mackenzie IR, McGeer PL (2000). Inflammation and Alzheimer disease. Neurobiol Aging 21:383–421. - PMC - PubMed
    1. Arnsten AF (1998). The biology of being frazzled. Science 280:1711–1712. - PubMed
    1. Behl C, Trapp T, Skutella T, Holsboer F (1997a). Protection against oxidative stress-induced neuronal cell death—a novel role for RU486. Eur J Neurosci 9:912–920. - PubMed
    1. Behl C, Lezoualc’h F, Trapp T, Widmann M, Skutella T, Holsboer F (1997b). Glucocorticoids enhance oxidative stress-induced cell death in hippocampal neurons in vitro. Endocrinology 138:101–106. - PubMed

Publication types