. 2006 May 24;26(21):5800-9.
doi: 10.1523/JNEUROSCI.0344-06.2006.

Silencing acid-sensing ion channel 1a alters cone-mediated retinal function

Affiliations

Silencing acid-sensing ion channel 1a alters cone-mediated retinal function

Mohammed Ettaiche et al. J Neurosci. .

Abstract

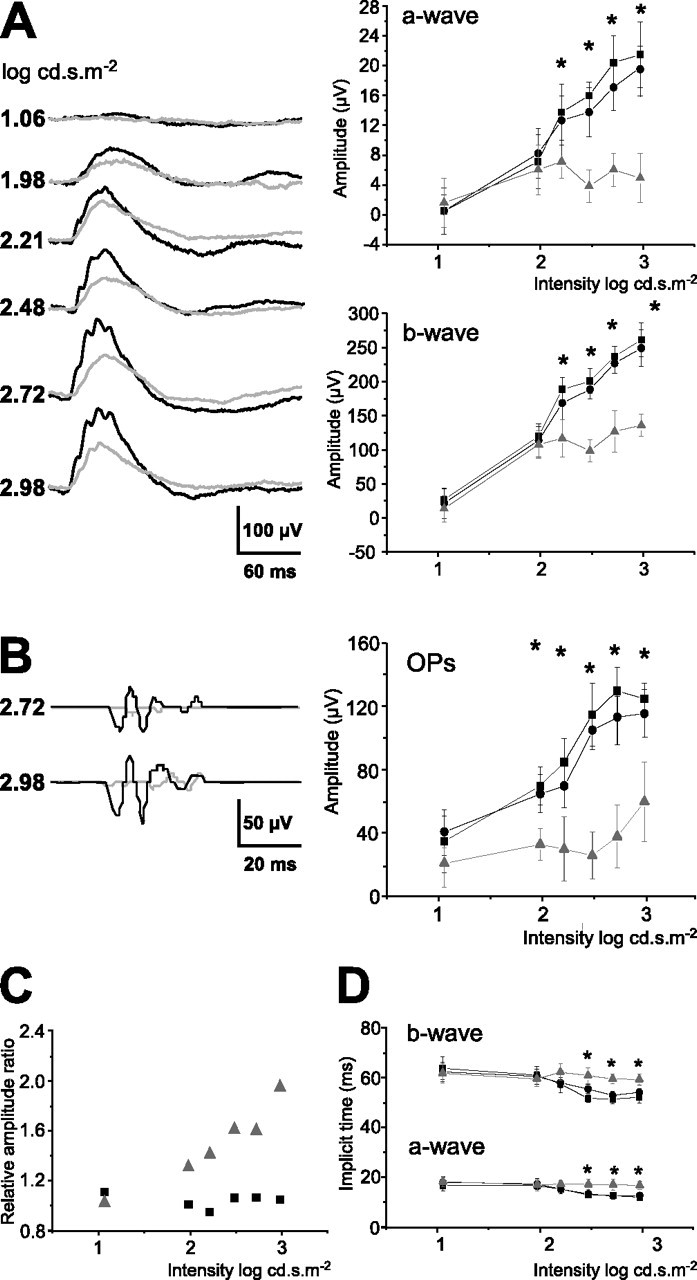
The action of extracellular protons on retinal activity and phototransduction occurs through pH-sensitive elements, mainly membrane conductances present on the different cell types of the outer and inner nuclear layers and of the ganglion cell layer. Acid-sensing ion channels (ASICs) are depolarizing conductances that are directly activated by protons. We investigated the participation of ASIC1a, a particular isoform of ASICs, in retinal physiology in vivo using electroretinogram measurements. In situ hybridization and immunohistochemistry localized ASIC1a in the outer and inner nuclear layers (cone photoreceptors, horizontal cells, some amacrine and bipolar cells) and in the ganglion cell layer. Both the in vivo knockdown of ASIC1a by antisense oligonucleotides and the in vivo blocking of its activity by PcTx1, a specific venom peptide, were able to decrease significantly and reversibly the photopic a- and b-waves and oscillatory potentials. Our study indicates that ASIC1a is an important channel in normal retinal activity. Being present in the inner segments of cones and inner nuclear layer cells, and mainly at synaptic cleft levels, it could participate in gain adaptation to ambient light of the cone pathway, facilitating cone hyperpolarization in brightness and modulating synaptic transmission of the light-induced visual signal.


Figures

Figure 1.
Figure 1.
Localization of ASIC1a in the retina. In situ hybridization experiments on rat retina were done using an ASIC1a antisense probe and a diaminobenzidine (brown-colored) detection. AC, Compared with cresyl violet dying (A) and sense probe used as control for nonspecific signal (B), ASIC1a probe revealed labeled cells in the outer nuclear layer, inner nuclear layer, and ganglion cell layer as indicated by black arrows (C). D, Binding experiments of 125I-PcTx1 on retina membranes was done to confirm the presence of ASIC1a protein in the retina. The saturation curve (left) and Scatchard graph (right) showed the presence of ASIC1a sites in retinal cells. The characteristics were a Bmax value of 1.6 fmol/mg total proteins, a Kd value of 25 pm (Fig. 2C), and a single site.
Figure 2.
Figure 2.
Immunodetection of ASIC1a in the retina. A, Western blot experiments using anti-ASIC1a antibody are shown on nontransfected (CTR) and ASIC1a-transfected (COS) COS cells, and rat retina extract (retina) the expression of ASIC1a protein at ∼60 kDa (predicted molecular weight, 59.6 kDa). Two minor bands (below and above) were also present in the ASIC1a-expressing conditions only. B, Immunolabeling rat retina with anti-ASIC1a antibodies revealed the presence of ASIC1a protein in cells and particularly at the synapse levels throughout the retina. Double labeling was done to specify the cellular types in the retina that expressed the ASIC1a protein. Arrows indicate observed signals. C, ASIC1a was colocalized within inner cone segment with PNA marker. D, It was also expressed by some of the calbindin-expressing cells that correspond to horizontal cells and particularly at the synapse levels onto photoreceptors. E, It was codetected with syntaxin as a marker of amacrine cells, at the membrane level (arrow pointing down), and the synapse level in the IPL (horizontal arrow), and displaced amacrine cells present in the GCL (arrow pointing up). F, ASIC1a was present in bipolar cell synapses in the IPL as shown by the colocalization with PKC. G, The Thy1.1 colabeling highlighted ASIC1a expression in ganglion cells and at the synapses with second-order cells in the IPL. OPL, Outer plexiform layer; ONL, outer nuclear layer; IS, inner segments; OS, outer segments.
Figure 3.
Figure 3.
Native proton-activated current from cultured rat retinal ganglion cell. Cultured rat retinal ganglion cells positively labeled by anti-Thy1 antibody (A, inset) were voltage clamped to a holding potential of −50 mV, and the native ASIC current was generated by an external pH drop (as indicated by the bars above each current traces). The dotted lines represent the zero current levels. A, pH-dependency relationship of the native ASIC current recorded form cultured rat retinal ganglion cells (n = 14 cells). B, Effects of the spider toxin PcTx1 (20 nm) and of ZnCl2 (300 μm) on the native ASIC current (n = 10 and 12, respectively). Error bars represent SEM.
Figure 4.
Figure 4.
Characterization of ASIC1a antisense oligonucleotides using the F-11 cell line. Native proton-activated inward current was recorded from F-11 cells using the whole-cell configuration of the patch-clamp technique at a holding potential of −50 mV. This current was generated following a rapid decrease of the external pH (from pH 7.4 to the pH value indicated at each current trace). The dotted lines represent the zero current level. A, The pH dependency of this native current is similar to the one of ASIC1a homomeric current, with a half-maximal activation pH0.5 = 6.21 ± 0.05 (n = 13 cells). B, Inhibition of the F-11 cells proton-activated native current by 20 nm of the spider toxin PcTX1 (n = 8 cells; p < 0.01, paired Student's t test). C, Comparison of the proton-activated current recorded from F-11 cells to ASIC1a homomeric current recorded from transfected COS cells. The inactivation time constants of both currents were measured using a monoexponential fit. As shown by the histogram, the homomeric ASIC1a current (black bars) has the same inactivation rates as those of the proton-activated F-11 cells native current (white bars; n = 8–26). D, RT-PCR experiments show that ASIC1a is the only ASIC subunit that is expressed in F-11 cells. E, Typical pH5-evoked native ASIC1a whole-cell currents recorded at −50 mV from F-11 cells treated or not for 24, 48, or 72 h with the AS1 or IS1 oligonucleotides. F, Statistical analysis of the native ASIC1a current amplitudes measured from F-11 cells treated with the AS1 or IS1 oligonucleotides or with the AS2 or IS2 oligonucleotides, or from control F-11 untreated cells (n = 10–36; ∗p < 0.05, ∗∗p < 0.01, ∗∗∗p < 0.001, Kruskal–Wallis test followed by Dunns post hoc test). Error bars represent SEM.
Figure 5.
Figure 5.
In vivo effects of PcTx1 on photopic ERGs. A, Typical recordings 4 h after PcTx1 treatment, with black curves corresponding to control experiments and gray curves to PcTx1 experiments. Values of the a-wave (top graph) and b-wave (bottom graph) amplitudes show sham control (black squares), buffer alone (black circles), and PcTx1 (gray triangles and gray line) conditions. B, Oscillatory potentials measured 4 h after PcTx1 treatment, with black curves corresponding to sham control experiments and gray curves to PcTx1 experiments. Values are plotted as amplitude of OPs at different intensities, showing sham control, buffer alone, and PcTx1 conditions (same symbols as above). Data are expressed as mean ± SD, and two-way ANOVA (ERG vs treatment and intensities) indicated a highly significant interaction between treatment and intensities (p < 0.0001 for a-wave, b-wave, and OPs, respectively). ∗p < 0.05 (Bonferroni's post hoc test was used to evaluate amplitude difference among individual intensities). C, Ratios of b-wave amplitude to a-wave amplitude were expressed as relative ratios and plotted as function of light intensities (black squares correspond to control condition and gray triangles to PcTx1 treatment). Each point is the ratio of n = 6 animals normalized to the ratio obtained in the control group (n = 6). D, A-wave and b-wave implicit times were measured from the flash onset to the peak of the a- and b-wave versus flash intensities and expressed as mean ± SD (Bonferroni's post hoc test was used to evaluate amplitude difference among individual intensities, ∗p < 0.05) (same symbols as in A).
Figure 6.
Figure 6.
In vivo effects of ASIC1a antisense on photopic ERGs. A, Typical ERG recordings 3 d after the second oligonucleotide injection at increasing light intensities with black curves corresponding to saline experiments and gray curves to antisense experiments. Values of a-wave (top graph) and b-wave (bottom graph) amplitude are plotted according to light intensities, showing saline-injected (black squares), sense (black circles), and antisense (gray triangles and gray line) conditions. B, Oscillatory potentials measured 3 d after antisense treatment, with black curves corresponding to saline experiments and gray curves to antisense experiments. Values are plotted as amplitude of OPs at different intensities, showing saline, sense, and antisense conditions (same symbols as above). Data are expressed as mean ± SD, and two-way ANOVA (ERG vs treatment and intensities) indicated a highly significant interaction between treatment and intensities (p < 0.0001 for a-wave, b-wave, and OPs). ∗p < 0.05 (Bonferroni's post hoc test was used to evaluate amplitude difference among individual intensities). C, Ratios of b-wave amplitude to a-wave amplitude were expressed as relative amplitude ratios and plotted as function of light intensities (black squares correspond to control condition and gray triangles to antisense treatment), and each point was the ratio of n = 6 animals normalized to the ratio obtained in the control group (n = 6). D, A-wave and b-wave implicit times were measured from the flash onset to the peak of the a- and b-wave versus flash intensities and expressed as mean ± SD (Bonferroni's post hoc test was used to evaluate amplitude difference among individual intensities; ∗p < 0.05) (same symbols as in A).
Figure 7.
Figure 7.
Time course of the in vivo effects on photopic ERGs of PcTx1 or antisense treatment. A, Percentage values of a-wave (left graph), b-wave (middle graph), and OP (right graph) amplitudes of the photopic ERGs plotted as percentage of the control intensity according to time elapsed from the injection time, showing sham (black squares), buffer alone (black circles), and PcTx1-injected (gray triangles) conditions. B, Percentage values of a-wave (left graph), b-wave (middle graph), and OP (right graph) amplitudes of the photopic ERGs plotted according to time elapsed from the injection time, showing saline (black squares), sense (black circles), and antisense conditions (gray triangles). Two-way ANOVA was performed (ERGs vs intensities and treatment; data not shown), and only the amplitude values of the a-wave, b-wave, and OPs obtained with each animal at high intensity (2.98 log cd.s.m−2) were normalized to control values obtained from the control group at each time point of the study. Values represent percentages of mean ± SD of the a-wave, b-wave, and OPs. ∗p < 0.05 (Bonferroni's post hoc test was used to evaluate amplitude difference among individual intensities).

References

    1. Akopian AN, Chen CC, Ding Y, Cesare P, Wood JN (2000). A new member of the acid-sensing ion channel family. NeuroReport 11:2217–2222. - PubMed
    1. Alvarez de la Rosa D, Krueger SR, Kolar A, Shao D, Fitzsimonds RM, Canessa CM (2003). Distribution, subcellular localization and ontogeny of ASIC1 in the mammalian central nervous system. J Physiol (Lond) 546:77–87. - PMC - PubMed
    1. Ayoub GS, Korenbrot JI, Copenhagen DR (1989). Release of endogenous glutamate from isolated cone photoreceptors of the lizard. Neurosci Res Suppl 10:S47–S55. - PubMed
    1. Barnes S, Merchant V, Mahmud F (1993). Modulation of transmission gain by protons at the photoreceptor output synapse. Proc Natl Acad Sci USA 90:10081–10085. - PMC - PubMed
    1. Barnett NL, Pow DV (2000). Antisense knockdown of GLAST, a glial glutamate transporter, compromises retinal function. Invest Ophthalmol Vis Sci 41:585–591. - PubMed

Publication types

LinkOut - more resources