. 2006 Sep 15;398(3):423-30.
doi: 10.1042/BJ20060537.

Targeted deletion of Gpbar1 protects mice from cholesterol gallstone formation

Affiliations

Targeted deletion of Gpbar1 protects mice from cholesterol gallstone formation

Galya Vassileva et al. Biochem J. .

Abstract

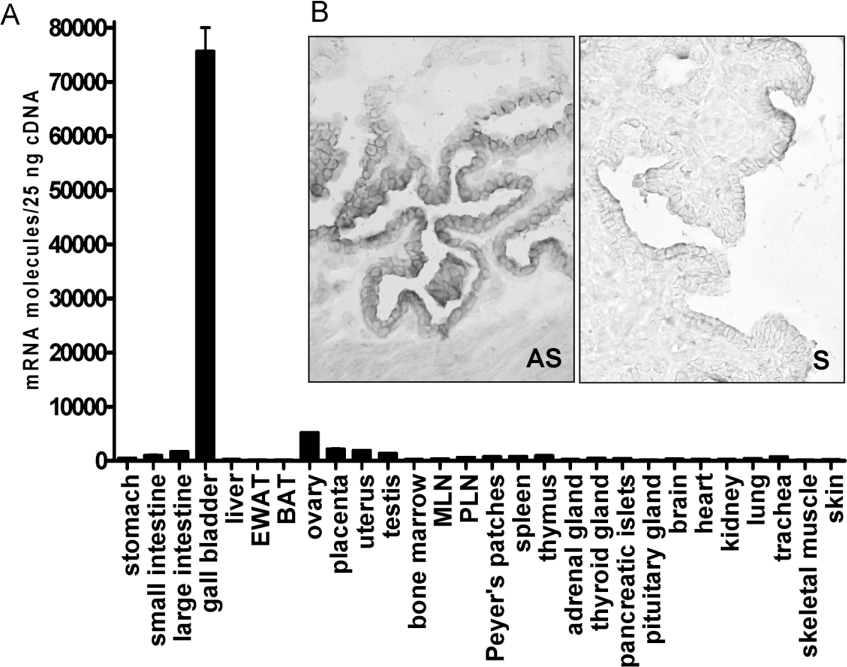
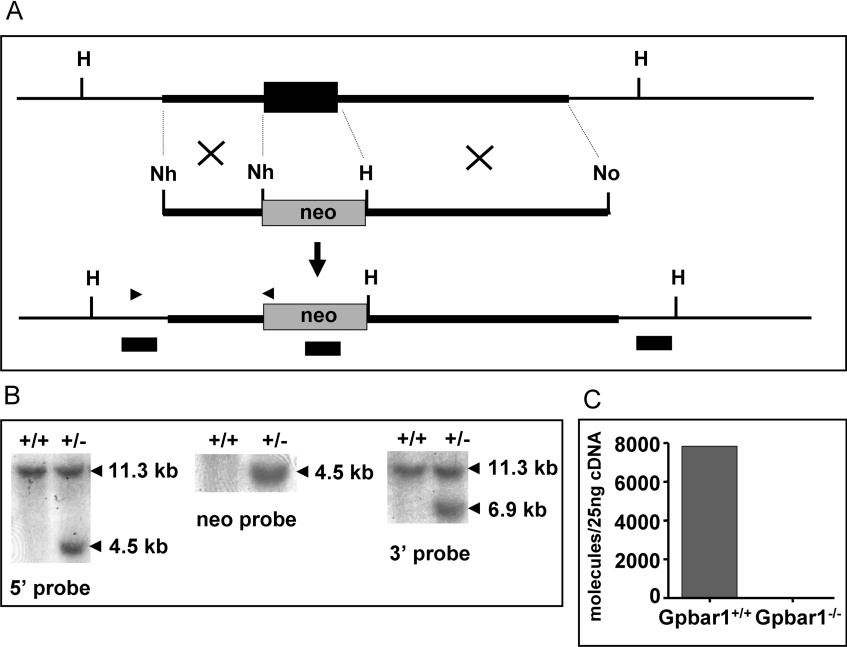
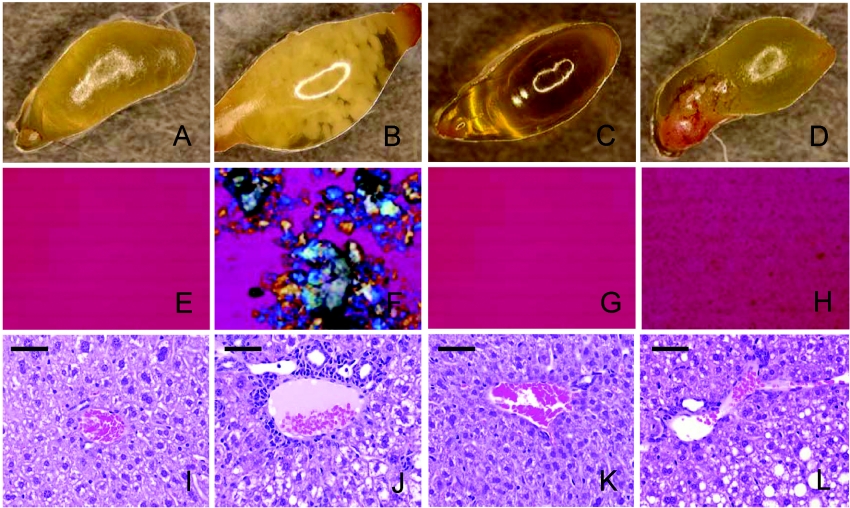
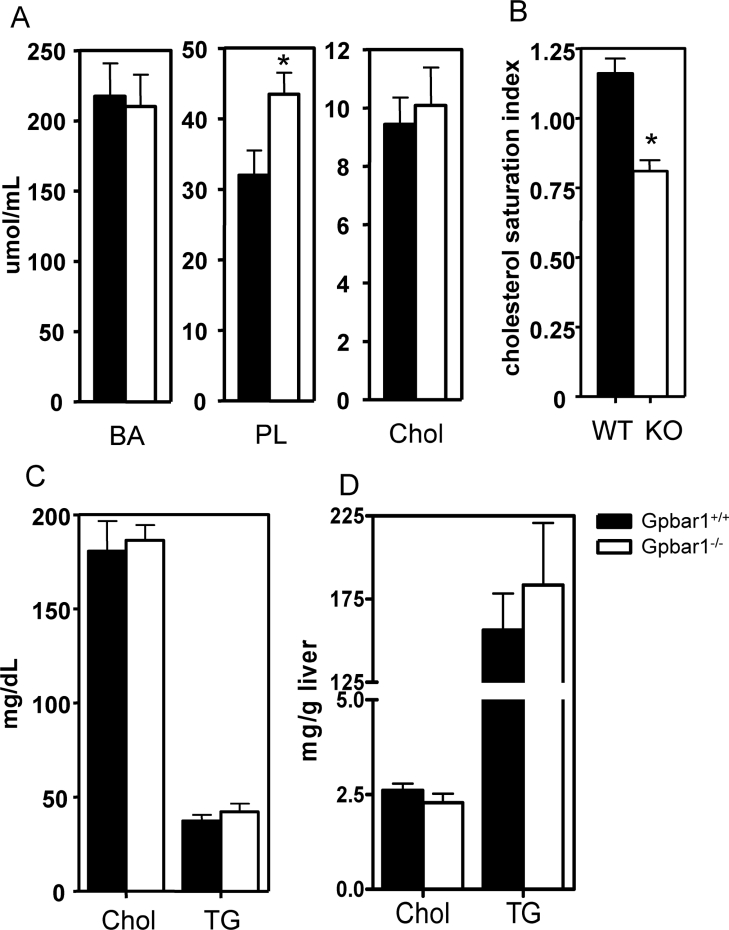
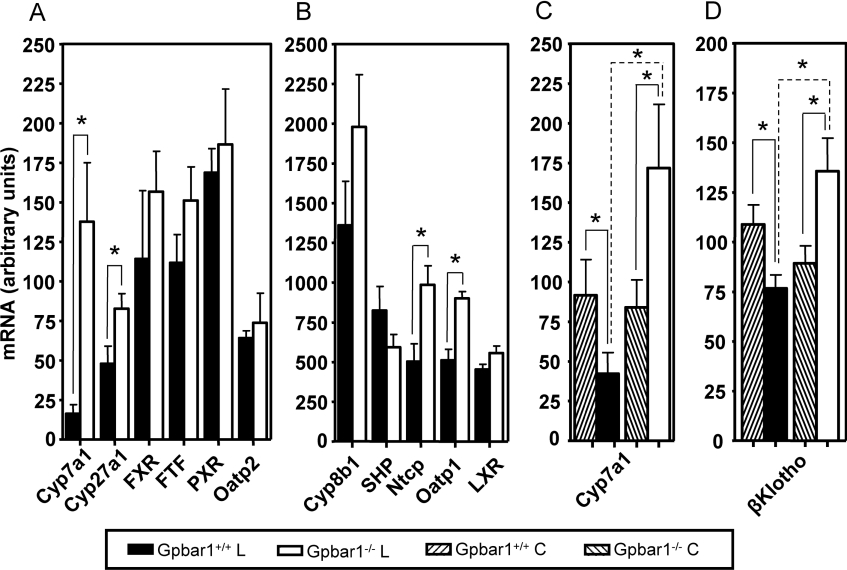
The Gpbar1 [G-protein-coupled BA (bile acid) receptor 1] is a recently identified cell-surface receptor that can bind and is activated by BAs, but its physiological role is unclear. Using targeted deletion of the Gpbar1 gene in mice, we show that the gene plays a critical role in the maintenance of bile lipid homoeostasis. Mice lacking Gpbar1 expression were viable, developed normally and did not show significant difference in the levels of cholesterol, BAs or any other bile constituents. However, they did not form cholesterol gallstones when fed a cholic acid-containing high-fat diet, and liver-specific gene expression indicated that Gpbar1-deficient mice have altered feedback regulation of BA synthesis. These results suggest that Gpbar1 plays a critical role in the formation of gallstones, possibly via a regulatory mechanism involving the cholesterol 7alpha-hydroxylase pathway.


Figures

Figure 1
Figure 1. Expression analysis of Gpbar1 gene
(A) Real-time quantitative PCR analysis (TaqMan) was performed using C57BL/6 mouse tissues from three mice and in duplicates. EWAT, epididymal white adipose tissue; BAT, brown adipose tissue; MLN, mesenteric lymph nodes; PLN, peripheral lymph nodes. (B) In situ hybridization: gall-bladder. Magnification, ×40. AS, antisense probe; S, sense probe.
Figure 2
Figure 2. Gene targeting of Gpbar1
(A) Top: wild-type Gpbar1 locus; black rectangle represents the exon; transcription is from left to right. Middle: targeting vector; thick lines represent regions of homology to Gpbar1 and shaded rectangle represents neo cassette. The restriction enzyme sites used to subclone these regions are indicated; H, HindIII; No, NotI; Nh, NheI. Bottom: Gpbar1 targeted locus; the positions of the oligonucleotide primers used to screen targeted ES cells are indicated with black arrowheads. (B) DNA probes (black rectangles) from 5′ upstream and 3′ downstream homologous regions of Gpbar1 gene and neo were used to screen the ES cells. An 11.3 kb and a 4.5 kb HindIII fragment were expected for the wild-type Gpbar1 locus and for the targeted locus respectively when the 5′ probe was used. An 11.3 kb and a 6.9 kb HindIII fragment were expected for the wild-type Gpbar1 locus and for the targeted locus respectively when the 3′ probe was used. (C) Real-time quantitative PCR analysis of Gpbar1 RNA from the gall-bladders of wild-type and knockout mice. No Gpbar1 mRNA is detected in the gall-bladders of Gpbar1−/− mice.
Figure 3
Figure 3. Biliary cholesterol crystallization and liver histopathology
Gall-bladder from (A) Gpbar1+/+ mice on chow, (B) Gpbar1+/+ mice on lithogenic diet, (C) Gpbar1−/− mice on chow and (D) Gpbar1−/− mice on lithogenic diet. Polarizing light microscopy of gall-bladder bile from (E) Gpbar1+/+ mice on chow, (F) Gpbar1+/+ mice on lithogenic diet, (G) Gpbar1−/− mice on chow and (H) Gpbar1−/− mice on lithogenic diet. Histological images of liver sections in portal triad from (I) Gpbar1+/+ mice on chow, (J) Gpbar1+/+ mice on lithogenic diet, (K) Gpbar1−/− mice on chow and (L) Gpbar1−/− mice on lithogenic diet. Magnification, ×10 (AD) and ×400 (EH). (IL) Scale bar, 50 μm.
Figure 4
Figure 4. Lipid profiles of mice fed on lithogenic diet
(A) Lipid compositions of gall-bladder bile. (B) CSI values of gall-bladder bile. (C) Serum cholesterol and TG levels. (D) Hepatic cholesterol and TG levels. Individual values were measured in from six to eight mice per group on lithogenic diet. Error bars represent S.D. *P<0.05 when compared with wild-type samples. PL, phospholipids; Chol, cholesterol.
Figure 5
Figure 5. Gene expression analysis
Real-time quantitative PCR analysis was performed on mRNA from livers of Gpbar1−/− and Gpbar1+/+ littermate mice. (A, B) BA synthesis-, regulation- and uptake-related genes. Individual values were measured from six mice per group on lithogenic diet. (C) Cyp7a1 expression and (D) βKlotho expression. Individual values were measured from nine mice per group on chow (C) and lithogenic (L) diet. Error bars represent S.D. *P<0.05 when compared with wild-type samples.

References

    1. Chiang J. Y. Bile acid regulation of hepatic physiology: III. Bile acids and nuclear receptors. Am. J. Physiol. Gastrointest. Liver Physiol. 2003;284:G349–G356. - PubMed
    1. Chiang J. Y. Regulation of bile acid synthesis: pathways, nuclear receptors, and mechanisms. J. Hepatol. 2004;40:539–551. - PubMed
    1. Russell D. W. The enzymes, regulation, and genetics of bile acid synthesis. Annu. Rev. Biochem. 2003;72:137–174. - PubMed
    1. Davis R. A., Miyake J. H., Hui T. Y., Spann N. J. Regulation of cholesterol-7alpha-hydroxylase: barely missing a SHP. J. Lipid Res. 2002;43:533–543. - PubMed
    1. Fuchs M. Bile acid regulation of hepatic physiology: III. Regulation of bile acid synthesis: past progress and future challenges. Am. J. Physiol. Gastrointest. Liver Physiol. 2003;284:G551–G557. - PubMed