Comparative Study
. 2006 May 26:6:46.
doi: 10.1186/1471-2180-6-46.

Genomic patterns of pathogen evolution revealed by comparison of Burkholderia pseudomallei, the causative agent of melioidosis, to avirulent Burkholderia thailandensis

Affiliations
Comparative Study

Genomic patterns of pathogen evolution revealed by comparison of Burkholderia pseudomallei, the causative agent of melioidosis, to avirulent Burkholderia thailandensis

Yiting Yu et al. BMC Microbiol. .

Abstract

Background: The Gram-negative bacterium Burkholderia pseudomallei (Bp) is the causative agent of the human disease melioidosis. To understand the evolutionary mechanisms contributing to Bp virulence, we performed a comparative genomic analysis of Bp K96243 and B. thailandensis (Bt) E264, a closely related but avirulent relative.

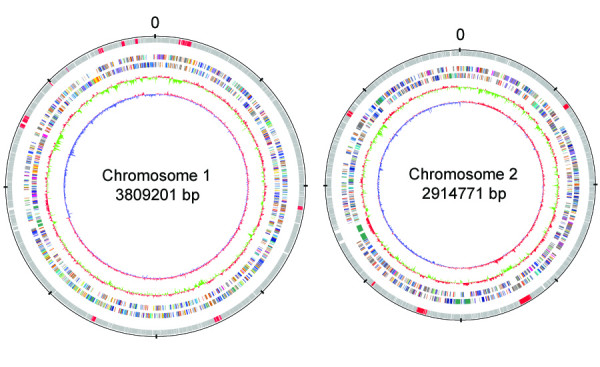
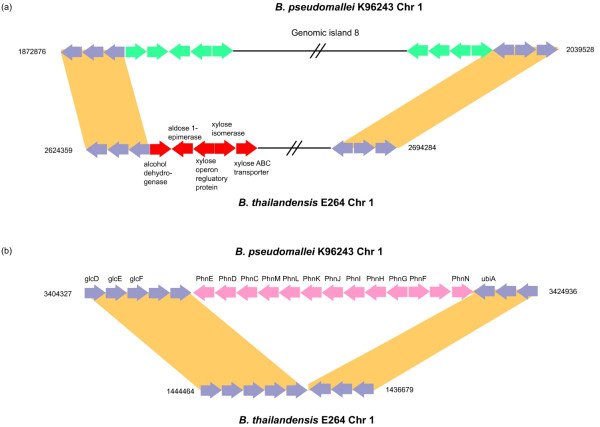
Results: We found the Bp and Bt genomes to be broadly similar, comprising two highly syntenic chromosomes with comparable numbers of coding regions (CDs), protein family distributions, and horizontally acquired genomic islands, which we experimentally validated to be differentially present in multiple Bt isolates. By examining species-specific genomic regions, we derived molecular explanations for previously-known metabolic differences, discovered potentially new ones, and found that the acquisition of a capsular polysaccharide gene cluster in Bp, a key virulence component, is likely to have occurred non-randomly via replacement of an ancestral polysaccharide cluster. Virulence related genes, in particular members of the Type III secretion needle complex, were collectively more divergent between Bp and Bt compared to the rest of the genome, possibly contributing towards the ability of Bp to infect mammalian hosts. An analysis of pseudogenes between the two species revealed that protein inactivation events were significantly biased towards membrane-associated proteins in Bt and transcription factors in Bp.

Conclusion: Our results suggest that a limited number of horizontal-acquisition events, coupled with the fine-scale functional modulation of existing proteins, are likely to be the major drivers underlying Bp virulence. The extensive genomic similarity between Bp and Bt suggests that, in some cases, Bt could be used as a possible model system for studying certain aspects of Bp behavior.


Figures

Figure 1
Figure 1
Schematic circular diagrams of the large and small chromosomes of the B. thailandensis genome. From outside to inside: scale; annotated CDSs, GIs represented by red; B. thailandensis COG categories (two circles), mean centered GC% content plot (red-high GC%, green-low GC%); mean centered (G-C)/(G+C) deviation plot (red-above mean, blue-below mean). Color coding for COG functions: gold, translation; orange, replication and transcription; yellow, nuclear structure; pink, defense mechanisms; tomato, signal transduction mechanisms; peachpuff, cell envelope biogenesis, outer membrane; purple, cell motility and secretion; red, cytoskeleton; green, extracellular structures; royalblue, energy metabolim; blue, central metabolism; aquamarine, secondary metabolism; gray, function unknown.
Figure 2
Figure 2
Prevalence of Bt-GIs in natural isolates of Bt. Distribution of Bt-GIs in Bt isolates (n = 29) as determined by PCR. For each GI, two genes were tested: the target genes that locate in the GIs and the flanking genes that are immediately abutting each putative island. This figure depicts the four possibilities for each genomic island: Positive for island and negative for flanking gene (blue), Negative for island and positive for flanking gene (red), Positive for both island and flanking gene (yellow), Negative for both island and flanking gene (green).
Figure 3
Figure 3
Genomic Synteny of theBp and Bt genomes. The Bt and Bp genomes are depicted on the x and y axes respectively. (a) Bt chr 1 forward strand versus Bp chr 1 forward strand; (b) Bt chr 2 forward strand versus Bp chr 2 forward strand. Inverted orientations of segments indicate regions of genomic inversion.
Figure 4
Figure 4
Comparison of xylose operon and phosphonate operons. (a) Insertion of Genomic island 8 (Bp-GI 8) and deletion of xylose operon (red) in Bp. The xylose utilization operon in Bt is absent in Bp, being replaced by Bp-GI 8. (b) A phosphonate gene cluster (pink) is present in Bp while absent in Bt. Genes in purple represent orthologous proteins. See Main Text for details.
Figure 5
Figure 5
Comparison of fimbriae and capsule biosynthesis regions. (a) Horizontal acquisition of a Yersinia-like fimbriae cluster (red) by Bp results in reaplcement of a flagellar biosynthesis cluster in Bt. (b) A capsular polysaccharide biosynthesis cluster (pink) in Bp replaces an ancestral polysaccharide cluster in Bt (orange). See Main Text for details.
Figure 6
Figure 6
Ka/Ks substitution curves and similarity comparisons of promoter regions. (a) Ka/Ks substitution curves for the orthologous virulence proteins, core metabolism proteins and total proteins. The y axis is the cumulative percentage for the corresponding Ka/Ks value on the x axis. The P values depict the statistical difference between virulence genes or core genes compared to the whole genome (b) Similarity of promoter regions for the orthologous virulence proteins, core metabolism proteins and total proteins. The y axis is the cumulative percentage for the corresponding homologous value on the x axis. The P value depicts the statistical difference between virulence or core genes to the whole genome.
Figure 7
Figure 7
Abundance graph for pseudogenes across different categories of functional inactivation. The x-axis depicts the multiple types of mutations that can cause pseudogene formation in Bp (blue) or Bt (purple).

References

    1. Walsh C. Molecular mechanisms that confer antibacterial drug resistance. Nature. 2000;406:775–781. doi: 10.1038/35021219. - DOI - PubMed
    1. Scarselli M, Giuliani MM, Adu-Bobie J, Pizza M, Rappuoli R. The impact of genomics on vaccine design. Trends Biotechnol. 2005;23:84–91. doi: 10.1016/j.tibtech.2004.12.008. - DOI - PubMed
    1. Baar C, Eppinger M, Raddatz G, Simon J, Lanz C, Klimmek O, Nandakumar R, Gross R, Rosinus A, Keller H, Jagtap P, Linke B, Meyer F, Lederer H, Schuster SC. Complete genome sequence and analysis of Wolinella succinogenes. Proc Natl Acad Sci. 2003;100:11690–11695. doi: 10.1073/pnas.1932838100. - DOI - PMC - PubMed
    1. Dobrindt U, Hochhut B, Hentschel U, Hacker J. Genomic islands in pathogenic and environmental microorganisms. Nat Rev Microbiol. 2004;2:414–424. doi: 10.1038/nrmicro884. - DOI - PubMed
    1. Chain PS, Carniel E, Larimer FW, Lamerdin J, Stoutland PO, Regala WM, Georgescu AM, Vergez LM, Land ML, Motin VL, Brubaker RR, Fowler J, Hinnebusch J, Marceau M, Medigue C, Simonet M, Chenal-Francisque V, Souza B, Dacheux D, Elliott JM, Derbise A, Hauser LJ, Garcia E. Insights into the evolution of Yersinia pestis through whole-genome comparison with Yersinia pseudotuberculosis. Proc Natl Acad Sci USA. 2004;101:13826–13831. doi: 10.1073/pnas.0404012101. - DOI - PMC - PubMed

Publication types

MeSH terms