

Isotopic evidence for large gaseous nitrogen losses from tropical rainforests
- PMID: 16728510
- PMCID: PMC1469773
- DOI: 10.1073/pnas.0510185103
Isotopic evidence for large gaseous nitrogen losses from tropical rainforests
Abstract
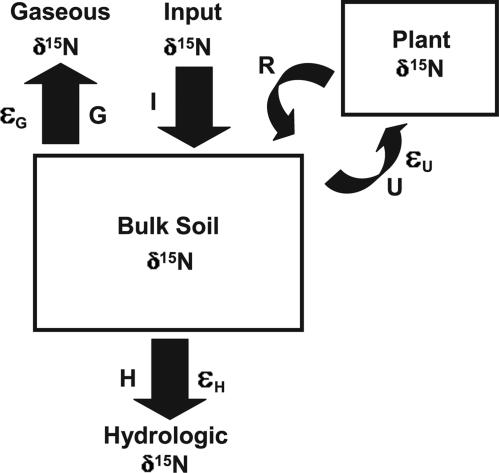
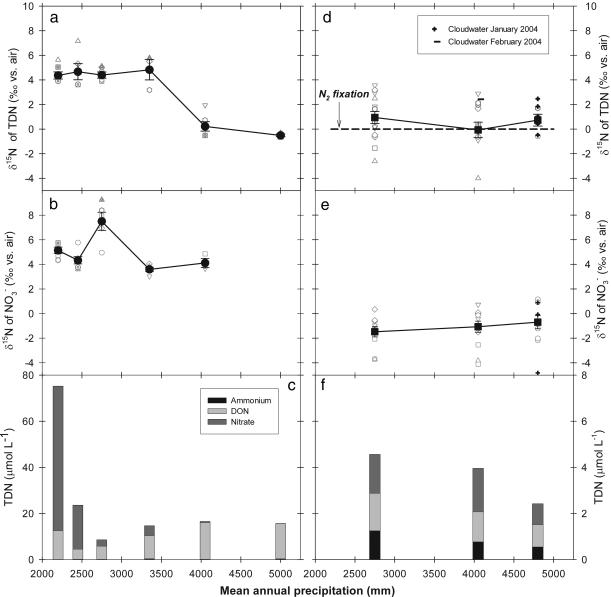
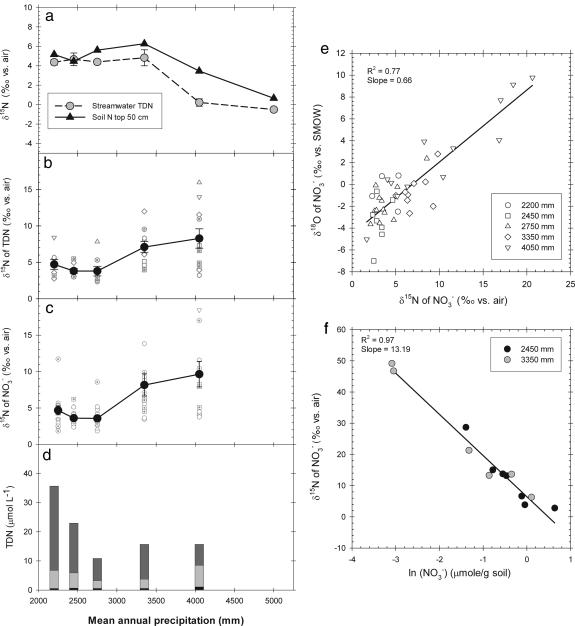
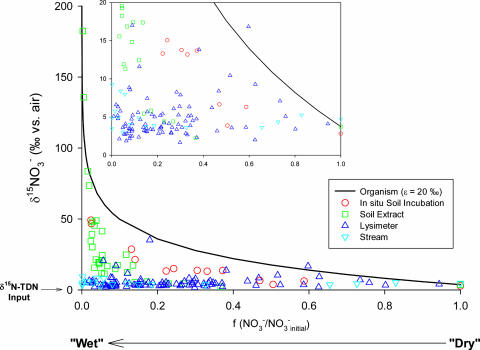
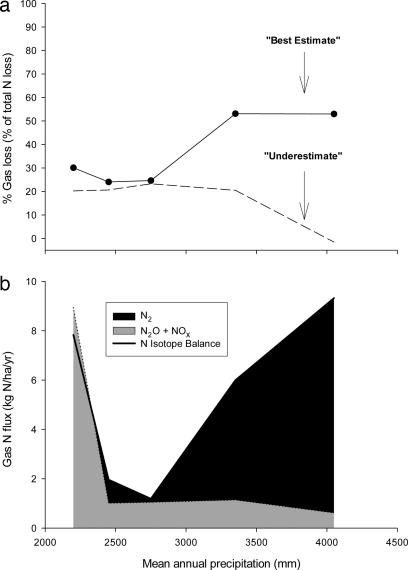
The nitrogen isotopic composition (15N/14N) of forested ecosystems varies systematically worldwide. In tropical forests, which are elevated in 15N relative to temperate biomes, a decrease in ecosystem 15N/14N with increasing rainfall has been reported. This trend is seen in a set of well characterized Hawaiian rainforests, across which we have measured the 15N/14N of inputs and hydrologic losses. We report that the two most widely purported mechanisms, an isotopic shift in N inputs or isotopic discrimination by leaching, fail to explain this climate-dependent trend in 15N/14N. Rather, isotopic discrimination by microbial denitrification appears to be the major determinant of N isotopic variations across differences in rainfall. In the driest climates, the 15N/14N of total dissolved outputs is higher than that of inputs, which can only be explained by a 14N-rich gas loss. In contrast, in the wettest climates, denitrification completely consumes nitrate in local soil environments, thus preventing the expression of its isotope effect at the ecosystem scale. Under these conditions, the 15N/14N of bulk soils and stream outputs decrease to converge on the low 15N/14N of N inputs. N isotope budgets that account for such local isotopic underexpression suggest that denitrification is responsible for a large fraction (24-53%) of total ecosystem N loss across the sampled range in rainfall.
Conflict of interest statement
Conflict of interest statement: No conflicts declared.
Figures
Similar articles
-
Foliar and fungal 15N:14N ratios reflect development of mycorrhizae and nitrogen supply during primary succession: testing analytical models.Oecologia. 2005 Dec;146(2):258-68. doi: 10.1007/s00442-005-0208-z. Epub 2005 Oct 28. Oecologia. 2005. PMID: 16096847
-
Evidence for a uniformly small isotope effect of nitrogen leaching loss: results from disturbed ecosystems in seasonally dry climates.Oecologia. 2016 Jun;181(2):323-33. doi: 10.1007/s00442-015-3433-0. Epub 2015 Sep 5. Oecologia. 2016. PMID: 26343040
-
Large losses of inorganic nitrogen from tropical rainforests suggest a lack of nitrogen limitation.Ecol Lett. 2012 Jan;15(1):9-16. doi: 10.1111/j.1461-0248.2011.01701.x. Epub 2011 Oct 24. Ecol Lett. 2012. PMID: 22017659
-
Nitrogen isotopes link mycorrhizal fungi and plants to nitrogen dynamics.New Phytol. 2012 Oct;196(2):367-382. doi: 10.1111/j.1469-8137.2012.04300.x. Epub 2012 Sep 11. New Phytol. 2012. PMID: 22963677 Review.
-
[Stable isotopes of carbon and nitrogen in soil ecological studies].Izv Akad Nauk Ser Biol. 2007 Jul-Aug;(4):475-89. Izv Akad Nauk Ser Biol. 2007. PMID: 17966909 Review. Russian.
Cited by
-
Microbial denitrification dominates nitrate losses from forest ecosystems.Proc Natl Acad Sci U S A. 2015 Feb 3;112(5):1470-4. doi: 10.1073/pnas.1416776112. Epub 2015 Jan 20. Proc Natl Acad Sci U S A. 2015. PMID: 25605898 Free PMC article.
-
Diet of the prehistoric population of Rapa Nui (Easter Island, Chile) shows environmental adaptation and resilience.Am J Phys Anthropol. 2017 Oct;164(2):343-361. doi: 10.1002/ajpa.23273. Epub 2017 Jun 30. Am J Phys Anthropol. 2017. PMID: 28664976 Free PMC article.
-
Low N2O and variable CH4 fluxes from tropical forest soils of the Congo Basin.Nat Commun. 2022 Jan 17;13(1):330. doi: 10.1038/s41467-022-27978-6. Nat Commun. 2022. PMID: 35039512 Free PMC article.
-
Soil resistance and recovery during neotropical forest succession.Philos Trans R Soc Lond B Biol Sci. 2023 Jan 2;378(1867):20210074. doi: 10.1098/rstb.2021.0074. Epub 2022 Nov 14. Philos Trans R Soc Lond B Biol Sci. 2023. PMID: 36373919 Free PMC article.
-
Nitrate dynamics in natural plants: insights based on the concentration and natural isotope abundances of tissue nitrate.Front Plant Sci. 2014 Jul 23;5:355. doi: 10.3389/fpls.2014.00355. eCollection 2014. Front Plant Sci. 2014. PMID: 25101106 Free PMC article. Review.
References
-
- Field C. B., Behrenfeld M. J., Randerson J. T., Falkowski P. Science. 1998;281:237–240. - PubMed
-
- Martinelli L. A., Piccolo M. C., Townsend A. R., Vitousek P. M., Cuevas E., McDowell W., Robertson G. P., Santos O. C., Treseder K. Biogeochemistry. 1999;46:45–65.
-
- Austin A. T., Vitousek P. M. Oecologia. 1998;113:519–529. - PubMed
-
- Handley L., Austin A., Robinson D., Scrimgeour C., Raven J., Heaton T., Schmidt S., Stewart G. Aust. J. Plant Physiol. 1999;26:185–199.
-
- Austin A. T., Sala O. E. Aust. J. Plant Physiol. 1999;26:293–295.
Publication types
MeSH terms
Substances
LinkOut - more resources
Full Text Sources
Other Literature Sources
