. 2006 Jun 6;103(23):8745-50.
doi: 10.1073/pnas.0510185103. Epub 2006 May 25.

Isotopic evidence for large gaseous nitrogen losses from tropical rainforests

Affiliations

Isotopic evidence for large gaseous nitrogen losses from tropical rainforests

Benjamin Z Houlton et al. Proc Natl Acad Sci U S A. .

Abstract

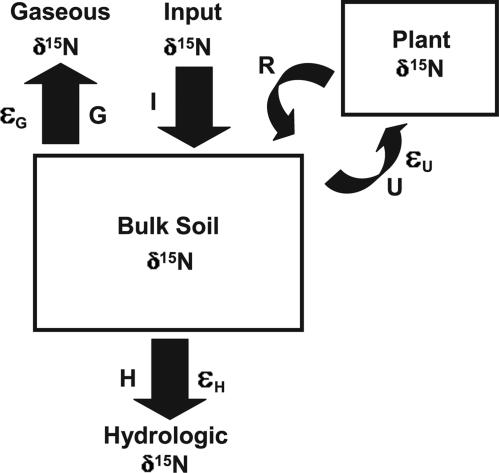
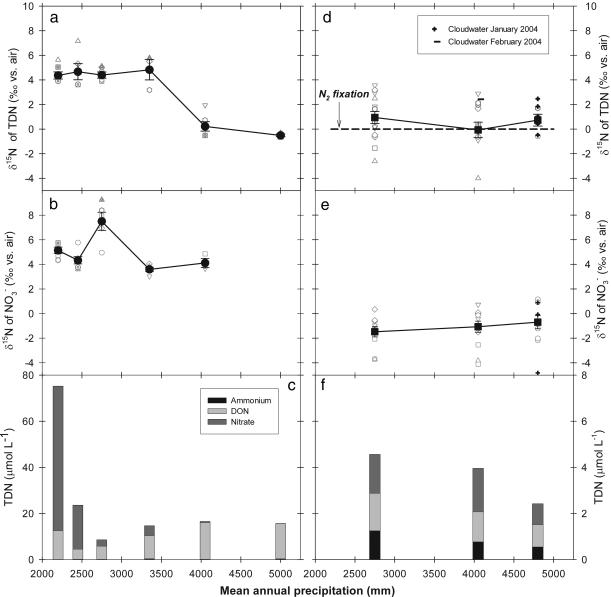
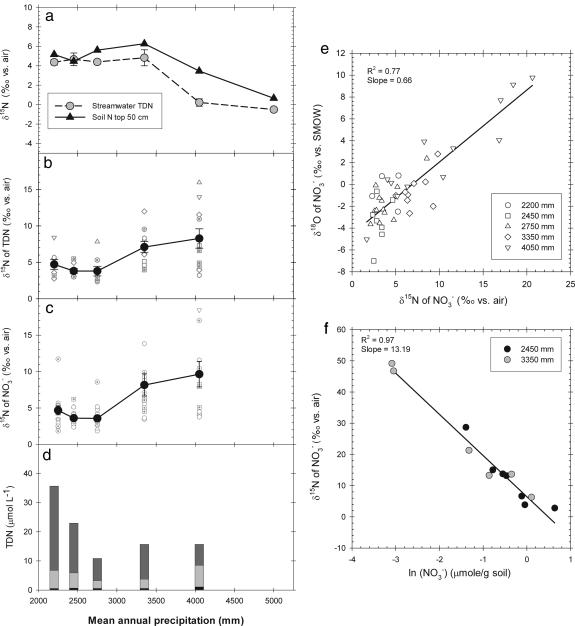
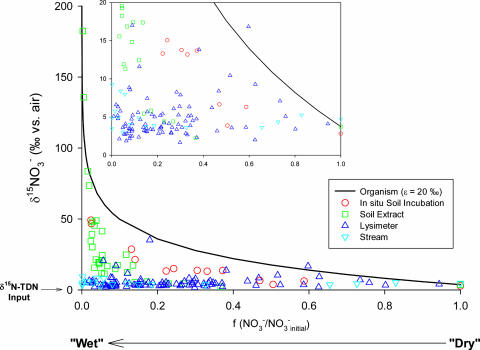
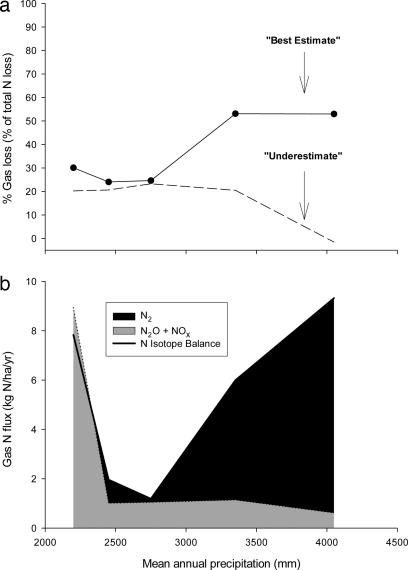
The nitrogen isotopic composition (15N/14N) of forested ecosystems varies systematically worldwide. In tropical forests, which are elevated in 15N relative to temperate biomes, a decrease in ecosystem 15N/14N with increasing rainfall has been reported. This trend is seen in a set of well characterized Hawaiian rainforests, across which we have measured the 15N/14N of inputs and hydrologic losses. We report that the two most widely purported mechanisms, an isotopic shift in N inputs or isotopic discrimination by leaching, fail to explain this climate-dependent trend in 15N/14N. Rather, isotopic discrimination by microbial denitrification appears to be the major determinant of N isotopic variations across differences in rainfall. In the driest climates, the 15N/14N of total dissolved outputs is higher than that of inputs, which can only be explained by a 14N-rich gas loss. In contrast, in the wettest climates, denitrification completely consumes nitrate in local soil environments, thus preventing the expression of its isotope effect at the ecosystem scale. Under these conditions, the 15N/14N of bulk soils and stream outputs decrease to converge on the low 15N/14N of N inputs. N isotope budgets that account for such local isotopic underexpression suggest that denitrification is responsible for a large fraction (24-53%) of total ecosystem N loss across the sampled range in rainfall.


Conflict of interest statement

Conflict of interest statement: No conflicts declared.

Figures

Fig. 1.
Fig. 1.
Conceptual model of controls on forest 15N/14N; soil N and plant N are boxed. I, nitrogen input flux to the forest; H and G, hydrologic leaching and gaseous fluxes, respectively; U and R, plant fluxes (uptake and return, respectively). εU, εH, and εG are effective (i.e., expressed) isotope effects for plant uptake and external hydrologic and gaseous losses, respectively [ε (in ‰) = (14k/15k − 1)·1,000, where k is the rate constant]. Under steady-state conditions, the N inputs into plants must balance the losses from it. Hence, the same flux-weighted δ15N that plants take up (U) is returned to the soil (R), resulting in no net change in soil δ15N by plant uptake processes. By contrast, losses of N to the external environment that fractionate against soil N isotopes (i.e., εH or εG) can lead to an elevation in soil δ15N relative to inputs. Consequently, at steady state, soil N isotopes can be modeled independently of plants: δ15Nsoil = δ15Ninputs + εH·(H/(H + G)) + εG·(G/(H + G)). In this study, we test which of the following best explains the soil δ15N variation across a rainfall sequence of tropical forests: (i) the δ15N of inputs, (ii) N isotope discrimination during hydrologic leaching (εH), or (iii) discrimination during gaseous N loss (εG).
Fig. 2.
Fig. 2.
Nitrogen isotope ratios and chemistry of small streams and atmospheric inputs across the rainforests. (a and b) In stream water, the 15N/14N of TDN (a) and of NO3 (b) are shown. (c) Stream water N species. (d and e) In atmospheric N inputs (precipitation and cloud water), the 15N/14N of TDN (d) and of NO3 (e) are shown; a δ15N of 0‰ for N2 fixation (11) is indicated in d. (f) Precipitation N species. Open gray symbols represent individual observations from 2001–2004 (see Supporting Materials and Methods); filled symbols connected by solid lines represent means ± 1 SE.
Fig. 3.
Fig. 3.
Nitrogen isotope ratios and chemistry in rainforest soils. (a) 15N/14N of the top 50 cm of bulk soil (14). (b and c) 15N/14N of TDN (b) and of NO3 (c) in soil solution from a 35-cm depth. (d) Soil solution N species. Symbols are the same as in Fig. 2. (e) Relationship between soil solution nitrate 15N/14N and 18O/16O across all sites. (f) 15N/14N of NO3 vs. the natural logarithm of soil NO3 concentration in a series of cores designed to eliminate processes other than denitrification, such as nitrification (by addition of N serve) and plant uptake (by removal of plant roots) (see Supporting Materials and Methods).
Fig. 4.
Fig. 4.
Isotopic expression of denitrification across sampling scales. The x axis is f, the fraction of nitrate remaining, which is the ratio of measured NO3 to the estimated initial NO3 concentration. We estimated the initial NO3 concentration and 15N/14N as follows: for the incubation experiment (see Supporting Materials and Methods and Fig. 3f), we used the highest extractable NO3 concentration and its corresponding 15N/14N; for soil extracts, we used the mean of the five highest NO3 concentrations and their corresponding 15N/14N; for lysimeters, we used the mean of the five highest soil water NO3 concentrations and their corresponding 15N/14N; for streams, we used the mean of the five highest stream water NO3 concentrations and their corresponding 15N/14N. The organism-level isotope effect line was calculated using an approximate form of the Rayleigh equation, δ15NO3 = δ15NO3 initial − ε·(ln(f)) (20), and an intrinsic ε of 20‰ (23, 24).
Fig. 5.
Fig. 5.
Partitioning of N losses by isotope balance. (a) The fraction of total N loss by gaseous N using stream and lysimeter isotope data. The following equation was solved for the fraction of total N loss by gaseous N using stream and lysimeter isotope data: δ15N-TDNdeposition (i.e., 0.47‰) = δ15Ngas·(fgas) + δ15NTDN·(1 − fgas), where f is the fraction of loss. In the “underestimate,” δ15Ngas was estimated as the weighted-mean δ15N of NO3 in stream water minus an ε of 20‰ (23, 24), and δ15N-TDN was taken from the stream water; in the “best estimate,” δ15Ngas was estimated as the weighted-mean δ15N of NO3 in deep soil waters minus an ε of 13.2‰, and δ15N-TDN was taken from the soil waters (Fig. 2f). (b) Estimated rates and forms of gaseous N loss. Fluxes were calculated by applying a linear regression for the relationship between rainfall and evapotranspiration to estimated stream flow (31). Also shown are in situ fluxes of NOx and N2O from ref. and P. A. Matson, personal communication. The N2 flux is estimated as the difference between total gas flux based on the N isotope balance and the N2O and NOx fluxes measured by chambers.

References

    1. Field C. B., Behrenfeld M. J., Randerson J. T., Falkowski P. Science. 1998;281:237–240. - PubMed
    1. Martinelli L. A., Piccolo M. C., Townsend A. R., Vitousek P. M., Cuevas E., McDowell W., Robertson G. P., Santos O. C., Treseder K. Biogeochemistry. 1999;46:45–65.
    1. Austin A. T., Vitousek P. M. Oecologia. 1998;113:519–529. - PubMed
    1. Handley L., Austin A., Robinson D., Scrimgeour C., Raven J., Heaton T., Schmidt S., Stewart G. Aust. J. Plant Physiol. 1999;26:185–199.
    1. Austin A. T., Sala O. E. Aust. J. Plant Physiol. 1999;26:293–295.

Publication types