. 2006 Sep 15;108(6):2020-8.
doi: 10.1182/blood-2005-11-013458. Epub 2006 May 25.

The molecular classification of multiple myeloma

Affiliations

The molecular classification of multiple myeloma

Fenghuang Zhan et al. Blood. .

Abstract

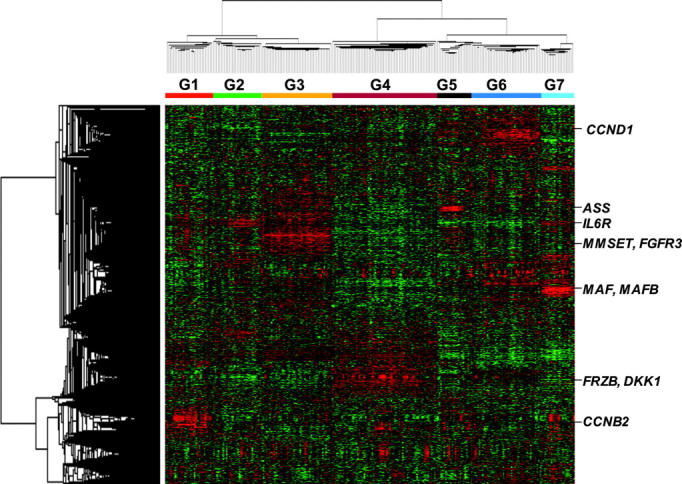
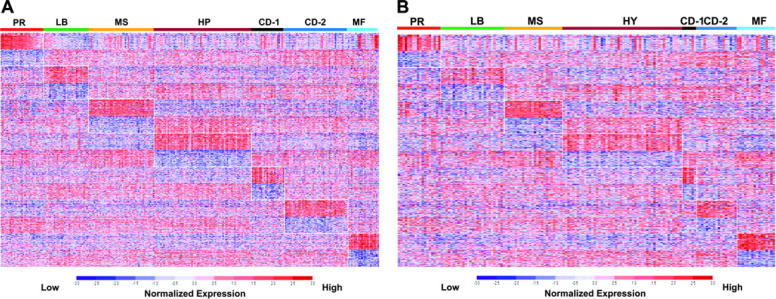
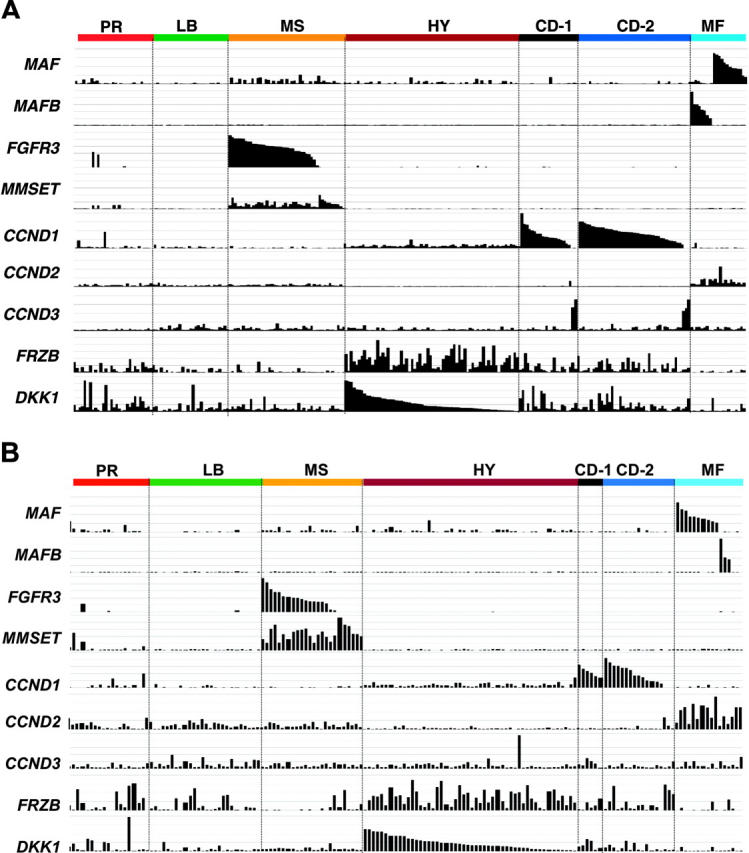
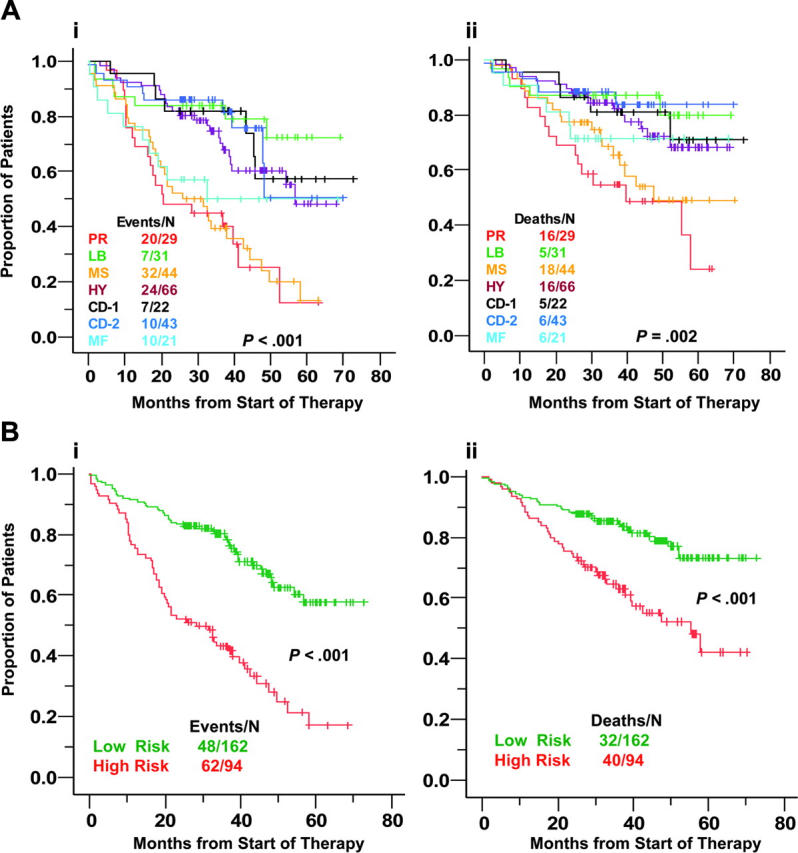
To better define the molecular basis of multiple myeloma (MM), we performed unsupervised hierarchic clustering of mRNA expression profiles in CD138-enriched plasma cells from 414 newly diagnosed patients who went on to receive high-dose therapy and tandem stem cell transplants. Seven disease subtypes were validated that were strongly influenced by known genetic lesions, such as c-MAF- and MAFB-, CCND1- and CCND3-, and MMSET-activating translocations and hyperdiploidy. Indicative of the deregulation of common pathways by gene orthologs, common gene signatures were observed in cases with c-MAF and MAFB activation and CCND1 and CCND3 activation, the latter consisting of 2 subgroups, one characterized by expression of the early B-cell markers CD20 and PAX5. A low incidence of focal bone disease distinguished one and increased expression of proliferation-associated genes of another novel subgroup. Comprising varying fractions of each of the other 6 subgroups, the proliferation subgroup dominated at relapse, suggesting that this signature is linked to disease progression. Proliferation and MMSET-spike groups were characterized by significant overexpression of genes mapping to chromosome 1q, and both exhibited a poor prognosis relative to the other groups. A subset of cases with a predominating myeloid gene expression signature, excluded from the profiling analyses, had more favorable baseline characteristics and superior prognosis to those lacking this signature.


Figures

Figure 1.
Figure 1.
Gene expression patterns in malignant plasma cells reveals that myeloma consists of 7 subgroups. Two-dimensional unsupervised hierarchic cluster analysis of 1559 highly variable genes (rows) in CD138-enriched plasma cells from 256 newly diagnosed multiple myeloma cases (columns). A mean-centered gene expression is depicted by a normalized-signal pseudocolor scale. Red and green indicate overexpressed and underexpressed genes, respectively. The sample dendrogram at the top and gene dendrogram to the side reflect the relatedness of the samples. Note that the dendrogram branches are strongly influenced by noticeable clusters of overexpressed genes. Subgroup designations 1 through 7, from left to right, are indicated under the dendrogram. Subgroup-specific gene clusters are indicated by colored bars to the right of the dendrogram.
Figure 2.
Figure 2.
Supervised clustering with SAM/PAM subgroup–defined genes in training and test sets. A supervised clustergram of the expression of 700 genes (50 SAM-defined overexpressed and underexpressed genes from each of the 7 subgroups) across the training set of 256 cases (A) and the test set of 158 cases (B). Genes are indicated along the vertical axis and samples on the horizontal axis. The normalized expression value for each gene is indicated by a color, with red representing high expression and blue representing low expression.
Figure 3.
Figure 3.
Subgroups are characterized by unique expression patterns. The Affymetrix signal (expression level: vertical axis) of MAF, MAFB, FGFR3, MMSET, CCND1, CCND2, CCND3, FRZB, and DKK1 from the 256 and 158 cases based on the clustergram sample distribution from Figure 2A and B, respectively. The expression levels for each gene are proportional to the height of each bar (representing a single patient sample). Note that spiked expression of CCND1, MAF and MAFB, and FGFR3 and MMSET is strongly correlated with specific subgroup designations. Also note that cases retaining the MMSET spike but lacking FGFR3 spikes maintain similar cluster designation, and MAF and MAFB spikes cluster in the same subgroups. Several MMSET spike–positive cases cluster in the proliferation subgroup. CCND2 expression was mutually exclusive of CCND1 expression. While highly correlated with the hyperdiploid subgroup, FRZB and DKK1 were both significantly underexpressed in groups LB and MF.
Figure 4.
Figure 4.
Molecular subgroups show differences in event-free and overall survival. (A) Kaplan-Meier estimates of event-free (i) and overall (ii) survival in the 7 subgroups showed that the 3-year actuarial probabilities of event-free survival were favorable at 84% in low bone disease (LB); 72% in hyperdiploid (HY); 82% in CD-1; and 86% in CD-2. High-risk was associated with proliferation (PR), MMSET (MS), and MAF/MAFB (MF), with 3-year estimates of event-free survival of 44% in PR and 39% in MS and 50% in MF. With respect to overall survival, the 3-year actuarial probabilities were 55% for PR, 69% for MS, 71% for MF, 81% for CD1, 84% for HY, 87% for LB, and 88% in CD2. (B) Event-free (i) and overall (ii) survival analysis of low-risk (HR, CD1, CD2, LB) and high-risk (PR, MF, MS) groups.

References

    1. Barlogie B, Shaughnessy J, Munshi N, Epstein J. Plasma cell myeloma. In: Beutler E, Lichtman M, Coller B, Kipps T, Seligsohn U, eds. Williams Hematology. 6th ed. New York, NY: McGraw-Hill; 2001: 1279-1304.
    1. Anderson K, Shaughnessy J Jr, Barlogie B, Harousseau J, Roodman G. Multiple myeloma. Hematology (Am Soc Hematol Educ Program). 2002; 214-240. - PubMed
    1. Roodman GD. Biology of osteoclast activation in cancer. J Clin Oncol. 2001;19: 3562-3571. - PubMed
    1. Heider U, Hofbauer LC, Zavrski I, Kaiser M, Jakob C, Sezer O. Novel aspects of osteoclast activation and osteoblast inhibition in myeloma bone disease. Biochem Biophys Res Commun. 2005;338: 687-693. - PubMed
    1. Stewart JP, Shaughnessy JD Jr. Role of osteoblast suppression in multiple myeloma. 2006;98: 1-13. - PubMed

Publication types

MeSH terms