Comparative Study
. 2005:1:2005.0001.
doi: 10.1038/msb4100004. Epub 2005 Mar 29.

A global view of pleiotropy and phenotypically derived gene function in yeast

Affiliations
Comparative Study

A global view of pleiotropy and phenotypically derived gene function in yeast

Aimée Marie Dudley et al. Mol Syst Biol. 2005.

Abstract

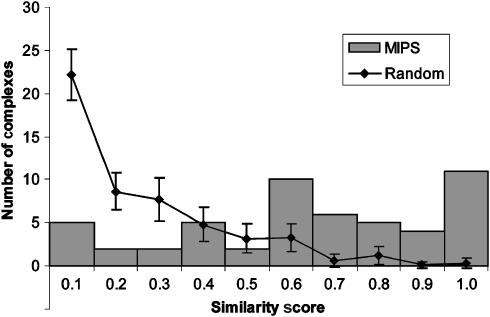
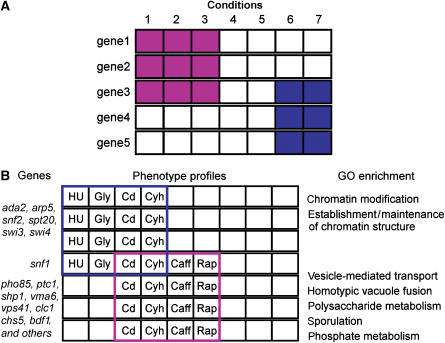
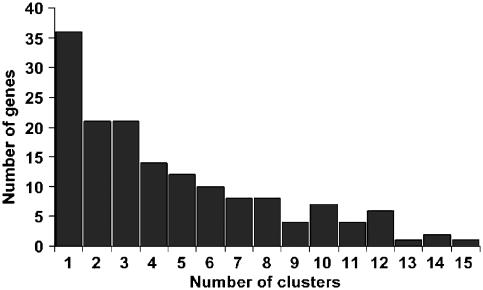
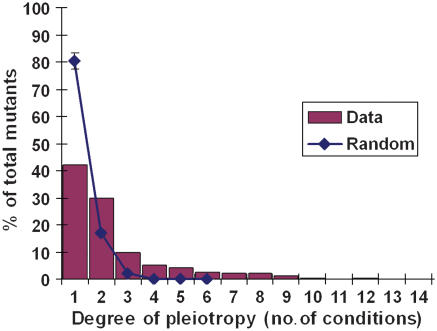
Pleiotropy, the ability of a single mutant gene to cause multiple mutant phenotypes, is a relatively common but poorly understood phenomenon in biology. Perhaps the greatest challenge in the analysis of pleiotropic genes is determining whether phenotypes associated with a mutation result from the loss of a single function or of multiple functions encoded by the same gene. Here we estimate the degree of pleiotropy in yeast by measuring the phenotypes of 4710 mutants under 21 environmental conditions, finding that it is significantly higher than predicted by chance. We use a biclustering algorithm to group pleiotropic genes by common phenotype profiles. Comparisons of these clusters to biological process classifications, synthetic lethal interactions, and protein complex data support the hypothesis that this method can be used to genetically define cellular functions. Applying these functional classifications to pleiotropic genes, we are able to dissect phenotypes into groups associated with specific gene functions.


Figures

Figure 1
Figure 1. Comparison of UV-sensitive mutants identified in this study, published results from Birrell et al, and a set of UVS mutants collected from the literature
The set of UVS mutants from this study only include those that showed UV sensitivity in both replicates. The inclusion of mutants that showed UV sensitivity in only one replicate in this study would increase the overlap with Birrell et al to 21 and the overlap with the literature to 23 mutants.
Figure 2
Figure 2. Cluster profiles (gray scale) and GO functional category enrichment (blue scale)
For clusters derived from mutants with growth defects in (A) one or two conditions or (B) three or more conditions, the percentage of cluster members with a given growth defect, the P-values of enrichment in a given GO category, and the number of genes in each cluster are shown. (C) A key to the color code scheme is also shown. Only clusters with >4 members and significant enrichment in at least one GO category are presented. Only the conditions present in at least one of these clusters are shown. The full data set is available at our website (Supplementary information).
Figure 3
Figure 3. Information obtained from phenotypic profile clustering
The members of bicluster 26, information about their protein complex membership, and the conditions used to assemble the bicluster are shown.
Figure 4
Figure 4. A comparison of the information derived from (A) phenotypic profile data and (B) synthetic lethal data
Complex 113 (the PAF transcriptional complex) and 137 (the Sap30 histone deacetylase complex) were taken from the Gavin et al data set. Black arrows indicate genetic interactions derived from membership in the same phenotypic cluster; black boxes highlight these same interactions for members of the same complex. Blue arrows indicate synthetic lethal interactions between CDC73 and members of either complex. The figures include only the protein complex subunits that were members of a phenotype profile cluster.
Figure 5
Figure 5. Phenotype similarity between members of the same protein complex
Scores range from 0 (no phenotypes in common) to 1 (all phenotypes in common). Gray bars depict results for the 52 MIPS complexes in which two or more members with growth defects in at least one of the 21 conditions screened. The line depicts the averages and standard deviations of 1000 permutations of randomly generated complexes.
Figure 6
Figure 6. Using phenotype profiles to identify separable functions in pleiotropic genes
(A) General principle. For a pleiotropic gene (gene3) with growth defects in five conditions (1–3, 6, and 7), it is possible to partition these phenotypes into two sets of functions (blue and purple) based on the results of biclustering. (B) SNF1 example. SNF1 belongs to two biclusters with the phenotypes (HU=hydroxyurea, Gly=glycerol, Cd=cadmium, Cyh=cycloheximide, Caff=caffeine, Rap=rapamycin) outlined in blue and purple. Subsets of the genes present and GO functional categories enriched in each bicluster are also listed.
Figure 7
Figure 7. Distribution of the number of phenotypically defined functions (biclusters) assigned to the pleiotropic genes in this data set
Figure 8
Figure 8. Distribution of pleiotropy in our data and 1000 randomly generated sets.
Error bars represent ±1 standard deviation. These distributions are significantly different as assessed by the Kolmogorov–Smirnov test with a P-value of 9 × 10−70.

Comment in

  • Multifunctional genes.
    van de Peppel J, Holstege FC. van de Peppel J, et al. Mol Syst Biol. 2005;1:2005.0003. doi: 10.1038/msb4100006. Epub 2005 Mar 29. Mol Syst Biol. 2005. PMID: 16729038 Free PMC article. No abstract available.

References

    1. Ashburner M, Ball CA, Blake JA, Botstein D, Butler H, Cherry JM, Davis AP, Dolinski K, Dwight SS, Eppig JT, Harris MA, Hill DP, Issel-Tarver L, Kasarskis A, Lewis S, Matese JC, Richardson JE, Ringwald M, Rubin GM, Sherlock G (2000) Gene ontology: tool for the unification of biology. The Gene Ontology Consortium. Nat Genet 25: 25–29 - PMC - PubMed
    1. Askwith CC, de Silva D, Kaplan J (1996) Molecular biology of iron acquisition in Saccharomyces cerevisiae . Mol Microbiol 20: 27–34 - PubMed
    1. Bianchi MM, Ngo S, Vandenbol M, Sartori G, Morlupi A, Ricci C, Stefani S, Morlino GB, Hilger F, Carignani G, Slonimski PP, Frontali L (2001) Large-scale phenotypic analysis reveals identical contributions to cell functions of known and unknown yeast genes. Yeast 18: 1397–1412 - PubMed
    1. Birrell GW, Giaever G, Chu AM, Davis RW, Brown JM (2001) A genome-wide screen in Saccharomyces cerevisiae for genes affecting UV radiation sensitivity. Proc Natl Acad Sci USA 98: 12608–12613 - PMC - PubMed
    1. Boutros M, Kiger AA, Armknecht S, Kerr K, Hild M, Koch B, Haas SA, Consortium HF, Paro R, Perrimon N (2004) Genome-wide RNAi analysis of growth and viability in Drosophila cells. Science 303: 832–835 - PubMed

Publication types

MeSH terms