. 2005:1:2005.0016.
doi: 10.1038/msb4100023. Epub 2005 Aug 2.

Expression dynamics of a cellular metabolic network

Affiliations

Expression dynamics of a cellular metabolic network

Peter Kharchenko et al. Mol Syst Biol. 2005.

Abstract

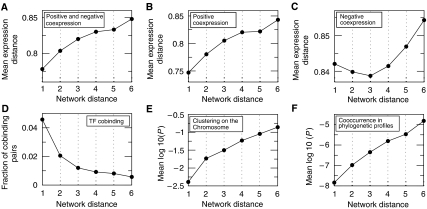
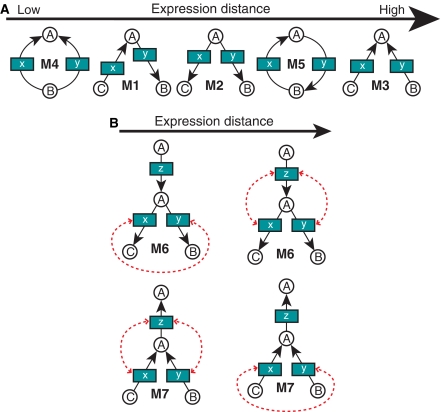
Toward the goal of understanding system properties of biological networks, we investigate the global and local regulation of gene expression in the Saccharomyces cerevisiae metabolic network. Our results demonstrate predominance of local gene regulation in metabolism. Metabolic genes display significant coexpression on distances smaller than the average network distance, a behavior supported by the distribution of transcription factor binding sites in the metabolic network and genome context associations. Positive gene coexpression decreases monotonically with distance in the network, while negative coexpression is strongest at intermediate network distances. We show that basic topological motifs of the metabolic network exhibit statistically significant differences in coexpression behavior.


Figures

Figure 1
Figure 1
Coexpression and functional associations on the scale of the whole metabolic network. Mean expression distance is plotted as a function of the metabolic network distance separating the metabolic gene pairs for (A) all metabolic gene pairs; (B) positively coexpressed pairs and (C) negatively coexpressed pairs. (D) Fraction of metabolic gene pairs that share at least one transcription factor binding site in their promoter region as a function of metabolic network distance. (E) Mean chromosome clustering gene pair association score dependency. (F) Mean phylogenetic profile cooccurrence association score dependency.
Figure 2
Figure 2
Coexpression in motifs of metabolite graph. (A) All irreversible metabolite graph motifs consisting of two genes (x and y) are analyzed using only positively coexpressed gene pairs. The motifs are ordered according to the mean expression distance of gene pairs belonging to each motif. (B) Two three-gene motifs (M6 and M7). Two distinct types of gene pairs within each motif are connected by dashed arrows. The pair types are ordered (from left to right) in the order of increasing mean expression distance.

References

    1. Bowers PM, Pellegrini M, Thompson MJ, Fierro J, Yeates TO, Eisenberg D (2004) Prolinks: a database of protein functional linkages derived from coevolution. Genome Biol 5: R35. - PMC - PubMed
    1. Causton HC, Ren B, Koh SS, Harbison CT, Kanin E, Jennings EG, Lee TI, True HL, Lander ES, Young RA (2001) Remodeling of yeast genome expression in response to environmental changes. Mol Biol Cell 12: 323–337 - PMC - PubMed
    1. Forster J, Famili I, Fu P, Palsson BO, Nielsen J (2003) Genome-scale reconstruction of the Saccharomyces cerevisiae metabolic network. Genome Res 13: 244–253 - PMC - PubMed
    1. Gasch AP, Spellman PT, Kao CM, Carmel-Harel O, Eisen MB, Storz G, Botstein D, Brown PO (2000) Genomic expression programs in the response of yeast cells to environmental changes. Mol Biol Cell 11: 4241–4257 - PMC - PubMed
    1. Ge H, Liu Z, Church GM, Vidal M (2001) Correlation between transcriptome and interactome mapping data from Saccharomyces cerevisiae. Nat Genet 29: 482–486 - PubMed

Publication types

MeSH terms

LinkOut - more resources