. 2006 Aug 15;91(4):1521-31.
doi: 10.1529/biophysj.105.077826. Epub 2006 May 26.

Elastic response, buckling, and instability of microtubules under radial indentation

Affiliations

Elastic response, buckling, and instability of microtubules under radial indentation

Iwan A T Schaap et al. Biophys J. .

Abstract

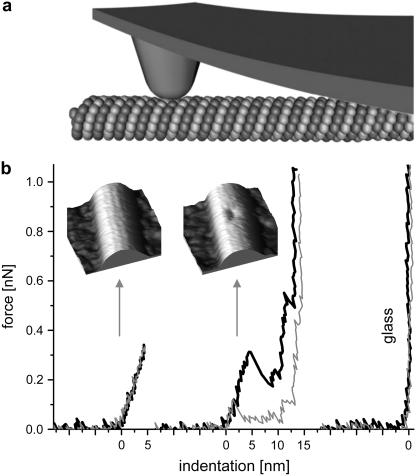
We tested the mechanical properties of single microtubules by lateral indentation with the tip of an atomic force microscope. Indentations up to approximately 3.6 nm, i.e., 15% of the microtubule diameter, resulted in an approximately linear elastic response, and indentations were reversible without hysteresis. At an indentation force of around 0.3 nN we observed an instability corresponding to an approximately 1-nm indentation step in the taxol-stabilized microtubules, which could be due to partial or complete rupture of a relatively small number of lateral or axial tubulin-tubulin bonds. These indentations were reversible with hysteresis when the tip was retracted and no trace of damage was observed in subsequent high-resolution images. Higher forces caused substantial damage to the microtubules, which either led to depolymerization or, occasionally, to slowly reannealing holes in the microtubule wall. We modeled the experimental results using finite-element methods and find that the simple assumption of a homogeneous isotropic material, albeit structured with the characteristic protofilament corrugations, is sufficient to explain the linear elastic response of microtubules.


Figures

FIGURE 1
FIGURE 1
(a) Sketch of the experiment (not to scale). The MT is built from tubulin proteins arranged in a tube. The AFM tip mounted on a cantilever deforms the MT locally. (b) Typical force-versus-indentation curves: black is the pushing curve, gray the retraction curve. The left curve shows that the MT deformed linearly and reversibly for forces up to 0.3 nN. The inset scan shows an MT after the pushing experiment. For the middle curve, more force was applied. The MT collapsed and the backward curve shows that the deformation is irreversible. The inset image shows the damaged MT afterward. The right curve was performed on glass.
FIGURE 2
FIGURE 2
Microtubule spring constants measured using two different types of cantilevers (0.03 N/m, n = 57, and 0.05 N/m, n = 50). The 14 experiments were performed on two different AFMs, each time using new cantilevers and samples. The Gaussian fit (performed on the cumulative histogram) gives 0.074 N/m ± 17% (mean ± SD).
FIGURE 3
FIGURE 3
Indentation experiments were performed close to a previously cut end of an MT (see inset). The graph shows spring constants (normalized to values obtained on the same MT far from the cut) and the force at which the MT collapsed. At distances >∼50 nm from the end of the MT, no effect was measurable; at lower distances, the MT rigidity seemed affected. The curve gives the spring constant predicted by FEM, using the thin-shell model, which also shows that end effects occurred only at distances <∼50 nm.
FIGURE 4
FIGURE 4
(a) MT topography and (b) simultaneously acquired stiffness map, with the darker colors representing softer regions. The MT was clearly softer than the background, and the stiffness on the MT was homogeneously distributed over its surface. Toward the sides, the stiffness was slightly reduced. Also the MT appeared stiffer when probed between the protofilaments, as indicated by the lines.
FIGURE 5
FIGURE 5
(a) Twenty-four indentation curves from five different experiments. The curves are shifted such that the first steps superimpose. At an average force of 0.27 nN a stepwise indentation of 1 nm is clearly visible, after which the deformation continues with a comparable slope. Then, at an average force of 0.35 nN, a sequence of multiple steps is seen, the collapse of the MT. (b) Individual curves on different MTs from different experiments. The gray curves show that the backward curves are almost identical to the forward, except that the backward jumps occurred at a lower force of 0.21 nN on average.
FIGURE 6
FIGURE 6
Self-healing MT. (a) The curve shows the force-versus-indentation preceding image b, where the tip indented the MT by 10 nm. (bd) This sequence of images shows that the MT closed over a period of 4 min (the fuzziness in the middle image is caused by the tip being almost out of contact, as a result of the low scan forces). Fiducial marks (highlighted in the background) were used to compensate for sample drift. No free tubulin was present in the solution, indicating that the reannealing must be due to reconnecting tubulin bonds.
FIGURE 7
FIGURE 7
Comparison of the scaling behavior of the analytical model and the FEM calculations. (a) Dependence of the tube's spring constant on t/R. The black curve shows the analytical result for formula image, which varies as (t/R)5/2 with a prefactor C = 1.38 (inset) to within <2% for t/R < 0.1. The corresponding FEM results for a symmetrically-loaded tube are shown in red. Also the FEM results for the tube that was loaded from the top and supported at the bottom over its whole length are shown in green. The scaling behavior for all models is identical, except that the prefactors depend on the boundary conditions. (b) Dependence of the deformed axial length on t/R. The black curve shows the analytical result. The prefactor was 0.7 (see inset). The FEM results for a symmetrically-loaded tube are shown in red and those for a top-loaded tube in green. The scaling behavior for all models is identical, except that the prefactors depend on the boundary conditions. For the top-loaded tube we found a prefactor of 1.2. The blue point gives the deformed length from the MT with protofilaments (where we used 1.1 nm for t (see also Fig. 9)); it shows that the presence of protofilaments do not cause a substantial shift in ℓ/R.
FIGURE 8
FIGURE 8
Effects of the finite tip size and wall thickness on the tube response. The tubes, with a 10-nm radius, were loaded from the top and supported over their whole length at the bottom. (a) Thin-shell model: effect of tip radius on the response of a tube with a wall thickness of 1.6 nm and a Young's modulus of 0.6 GPa. At indentations up to 4 nm, with realistic tip sizes up to 40 nm, the effects are small, at most 10%. At larger deformations, the effects of the tip size become evident. (b) Thick-shell model: dependence of the response on the wall thickness. The Young's modulus was calculated using Eq. 3. The tube softens (buckles) at small deformations. This effect is most obvious for the thinnest wall. The critical indentation for buckling scales with the wall thickness. Indenting with a bigger tip radius partly masks this effect. This masking is stronger for bigger wall thicknesses.
FIGURE 9
FIGURE 9
MT model including the protofilaments. The Young's modulus was set to 0.6 GPa. The behavior was very similar to that of the thick-walled tubes. The graph shows the difference in response between pushing on top of the protofilament or between two protofilaments (by rotating the model). The difference is ∼13% and was also visible in our experiments (Fig. 4).
FIGURE 10
FIGURE 10
Force-indentation curve showing the 1-nm step. The shaded part indicates the work needed for the observed instability. The work was measured by the difference between the measured force-indentation curve and backward-extrapolated from the curve section after the step. This gives 1.35 × 10⁻¹⁹ J (32.8 kBT).

References

    1. Alberts, B., A. Johnson, J. Lewis, M. Raff, K. Roberts, and P. Walter. 2002. Molecular Biology of the Cell. Garland Science, New York.
    1. Gardel, M. L., J. H. Shin, F. C. MacKintosh, L. Mahadevan, P. Matsudaira, and D. A. Weitz. 2004. Elastic behavior of cross-linked and bundled actin networks. Science. 304:1301–1305. - PubMed
    1. Tilney, L. G., J. Bryan, D. J. Bush, K. Fujiwara, M. S. Mooseker, D. B. Murphy, and D. H. Snyder. 1973. Microtubules: evidence for 13 protofilaments. J. Cell Biol. 59:267–275. - PMC - PubMed
    1. Pierson, G. B., P. R. Burton, and R. H. Himes. 1978. Alterations in number of protofilaments in microtubules assembled in vitro. J. Cell Biol. 76:223–228. - PMC - PubMed
    1. Nogales, E., S. G. Wolf, and K. H. Downing. 1998. Structure of the αβ tubulin dimer by electron crystallography. Nature. 391:199–203. - PubMed

Publication types