Imaging breast adipose and fibroglandular tissue molecular signatures by using hybrid MRI-guided near-infrared spectral tomography
- PMID: 16731633
- PMCID: PMC1482663
- DOI: 10.1073/pnas.0509636103
Imaging breast adipose and fibroglandular tissue molecular signatures by using hybrid MRI-guided near-infrared spectral tomography
Abstract
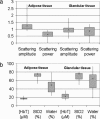
Magnetic resonance (MR)-guided near-infrared spectral tomography was developed and used to image adipose and fibroglandular breast tissue of 11 normal female subjects, recruited under an institutional review board-approved protocol. Images of hemoglobin, oxygen saturation, water fraction, and subcellular scattering were reconstructed and show that fibroglandular fractions of both blood and water are higher than in adipose tissue. Variation in adipose and fibroglandular tissue composition between individuals was not significantly different across the scattered and dense breast categories. Combined MR and near-infrared tomography provides fundamental molecular information about these tissue types with resolution governed by MR T1 images.
Conflict of interest statement
Conflict of interest statement: No conflicts declared.
Figures


Similar articles
-
MR-Guided Near-Infrared Spectral Tomography Increases Diagnostic Performance of Breast MRI.Clin Cancer Res. 2015 Sep 1;21(17):3906-12. doi: 10.1158/1078-0432.CCR-14-2546. Epub 2015 May 27. Clin Cancer Res. 2015. PMID: 26019171 Free PMC article.
-
Developments in quantitative oxygen-saturation imaging of breast tissue in vivo using multispectral near-infrared tomography.Antioxid Redox Signal. 2007 Aug;9(8):1143-56. doi: 10.1089/ars.2007.1643. Antioxid Redox Signal. 2007. PMID: 17627478 Review.
-
Combining near-infrared tomography and magnetic resonance imaging to study in vivo breast tissue: implementation of a Laplacian-type regularization to incorporate magnetic resonance structure.J Biomed Opt. 2005 Sep-Oct;10(5):051504. doi: 10.1117/1.2098627. J Biomed Opt. 2005. PMID: 16292948
-
In vivo hemoglobin and water concentrations, oxygen saturation, and scattering estimates from near-infrared breast tomography using spectral reconstruction.Acad Radiol. 2006 Feb;13(2):195-202. doi: 10.1016/j.acra.2005.10.002. Acad Radiol. 2006. PMID: 16428055
-
Mismatch between Tissue Partial Oxygen Pressure and Near-Infrared Spectroscopy Neuromonitoring of Tissue Respiration in Acute Brain Trauma: The Rationale for Implementing a Multimodal Monitoring Strategy.Int J Mol Sci. 2021 Jan 23;22(3):1122. doi: 10.3390/ijms22031122. Int J Mol Sci. 2021. PMID: 33498736 Free PMC article. Review.
Cited by
-
MR-Guided Near-Infrared Spectral Tomography Increases Diagnostic Performance of Breast MRI.Clin Cancer Res. 2015 Sep 1;21(17):3906-12. doi: 10.1158/1078-0432.CCR-14-2546. Epub 2015 May 27. Clin Cancer Res. 2015. PMID: 26019171 Free PMC article.
-
A microcomputed tomography guided fluorescence tomography system for small animal molecular imaging.Rev Sci Instrum. 2009 Apr;80(4):043701. doi: 10.1063/1.3109903. Rev Sci Instrum. 2009. PMID: 19405660 Free PMC article.
-
Assessment of Functional Differences in Malignant and Benign Breast Lesions and Improvement of Diagnostic Accuracy by Using US-guided Diffuse Optical Tomography in Conjunction with Conventional US.Radiology. 2016 Aug;280(2):387-97. doi: 10.1148/radiol.2016151097. Epub 2016 Mar 2. Radiology. 2016. PMID: 26937708 Free PMC article.
-
Combined optical imaging and mammography of the healthy breast: optical contrast derived from breast structure and compression.IEEE Trans Med Imaging. 2009 Jan;28(1):30-42. doi: 10.1109/TMI.2008.925082. IEEE Trans Med Imaging. 2009. PMID: 19116186 Free PMC article.
-
Target depth-regularized reconstruction in diffuse optical tomography using ultrasound segmentation as prior information.Biomed Opt Express. 2020 May 28;11(6):3331-3345. doi: 10.1364/BOE.388816. eCollection 2020 Jun 1. Biomed Opt Express. 2020. PMID: 32637258 Free PMC article.
References
-
- Shafer-Peltier K. E., Haka A. S., Fitzmaurice M., Crowe J., Myles J., Dasari R. R., Feld M. S. J. Raman Spectrosc. 2002;33:552–563.
-
- Xu Y. Z., Zhao Y., Xu Z., Ren Y., Liu Y. H., Zhang Y. F., Zhou X. S., Shi J. S., Xu D. F., Wu J. G. Spectrosc. Spectral Anal. 2005;25:1775–1778. - PubMed
-
- Haka A. S., Shafer-Peltier K. E., Fitzmaurice M., Crowe J., Dasari R. R., Feld M. S. Cancer Res. 2002;62:5375–5380. - PubMed
-
- Cerussi A. E., Berger A. J., Bevilacqua F., Shah N., Jakubowski D., Butler J., Holcombe R. F., Tromberg B. J. Academic Radiol. 2001;8:211–218. - PubMed
-
- Pogue B. W., Jiang S., Dehghani H., Kogel C., Soho S., Srinivasan S., Song X., Tosteson T. D., Poplack S. P., Paulsen K. D. J. Biomed. Opt. 2004;9:541–552. - PubMed
Publication types
MeSH terms
Substances
Grants and funding
LinkOut - more resources
Full Text Sources
Other Literature Sources
Medical

