. 2006:2:2006.0005.
doi: 10.1038/msb4100047. Epub 2006 Jan 31.

Ab initio genotype-phenotype association reveals intrinsic modularity in genetic networks

Affiliations

Ab initio genotype-phenotype association reveals intrinsic modularity in genetic networks

Noam Slonim et al. Mol Syst Biol. 2006.

Abstract

Microbial species express an astonishing diversity of phenotypic traits, behaviors, and metabolic capacities. However, our molecular understanding of these phenotypes is based almost entirely on studies in a handful of model organisms that together represent only a small fraction of this phenotypic diversity. Furthermore, many microbial species are not amenable to traditional laboratory analysis because of their exotic lifestyles and/or lack of suitable molecular genetic techniques. As an adjunct to experimental analysis, we have developed a computational information-theoretic framework that produces high-confidence gene-phenotype predictions using cross-species distributions of genes and phenotypes across 202 fully sequenced archaea and eubacteria. In addition to identifying the genetic basis of complex traits, our approach reveals the organization of these genes into generic preferentially co-inherited modules, many of which correspond directly to known enzymatic pathways, molecular complexes, signaling pathways, and molecular machines.


Figures
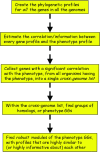
Figure 1
Figure 1
A schematic overview of the approach.
Figure 2
Figure 2
Results for motility GGs. (A) Phylogenetic profiles of the five most informative modules. Rows correspond to motility GGs and columns to organisms; each entry indicates whether a particular motility GG is represented in the genome of a specific organism (red for motile and yellow for non-motile); the green bars indicate the correlation (in bits) between every motility GG and the motility phenotype; the average joint-assignment probability in each module is specified on the right (see Materials and methods). (B) Every entry in this matrix indicates the probability of two motility GGs to be placed in the same cluster by the clustering algorithm, that is, their joint-assignment probability.
Figure 3
Figure 3
Motility GGs in the E. coli genome. (A) Depiction of the chemotaxis pathway and flagellar apparatus in E. coli. Genes detected by our approach are highlighted in red. (B) Count matrices of known motility genes in E. coli, not detected by our approach; red rows correspond to genes that were detected by our analysis, and are shown here for comparison; the third ‘p− g−' column indicates the number of organisms in our data, without the phenotype and without the gene; the next three columns are defined similarly; the seventh column indicates the gene–phenotype correlation (in bits); some genes (fliO, cheZ) are too specific, while others (fliI, cheY) are too abundant.
Figure 4
Figure 4
Results for Gram-negative GGs. (A) Phylogenetic profiles of four Gram-negative GG modules. Each entry indicates whether a particular Gram-negative GG is represented in the genome of a specific organism (red for Gram-negatives and yellow for Gram-positives). (B) Depiction of the lipid-A biosynthesis pathway in E. coli. Genes detected by our approach are highlighted in red. (C) Count matrices of known lipid-A biosynthesis E. coli genes, not detected by our approach (red row for lpxD is presented for comparison). See Figure 2B for columns descriptions.
Figure 5
Figure 5
Examples of GG modules obtained for the three respiration phenotypes. The two modules at the upper part (with suffix ‘ae') correspond to two aerobic GG modules; the two modules in the middle (with suffix ‘fa') correspond to two facultative GG modules; the three modules at the bottom (with suffix ‘an') correspond to three anaerobic GG modules. Each entry indicates whether a GG is represented in the genome of a specific organism (red for strict aerobes, orange for facultatives, and yellow for strict anaerobes).
Figure 6
Figure 6
Phylogenetic profiles of the three most robust modules of endospore GGs. Each entry indicates whether an endospore GG is represented in the genome of a specific organism (red for sporulating organisms and yellow for nonsporulating ones).
Figure 7
Figure 7
Phylogenetic profiles of six robust modules of intracellular pathogenicity GGs. Each entry indicates whether an intracellular pathogenicity GG is represented in the genome of a specific organism (red for intracellular pathogens, yellow for extracellular pathogens).

References

    1. Alberts B, Bray D, Lewis J, Raff M, Roberts K, Watson J (1994) Molecular Biology of the Cell. New York: Garland Science Publishing
    1. Altschul SF, Gish W, Miller W, Myers EW, Lipman DJ (1990) Basic local alignment search tool. J Mol Biol 215: 403–410 - PubMed
    1. Berardi MJ, Bushweller JH (1999) Binding specificity and mechanistic insight into glutaredoxin-catalyzed protein disulfide reduction. J Mol Biol 292: 151–161 - PubMed
    1. Collazo CM, Galan JE (1997) The invasion-associated type III system of Salmonella typhimurium directs the translocation of Sip proteins into the host cell. Mol Microbiol 24: 747–756 - PubMed
    1. Copley SD, Dhillon JK (2002) Lateral gene transfer and parallel evolution in the history of glutathione biosynthesis genes. Genome Biol 3: research0025.1–0025.16 - PMC - PubMed

Publication types