. 2006 Oct;21(2):119-29.
doi: 10.1007/s10827-006-7949-5. Epub 2006 May 26.

Parallel network simulations with NEURON

Affiliations

Parallel network simulations with NEURON

M Migliore et al. J Comput Neurosci. 2006 Oct.

Abstract

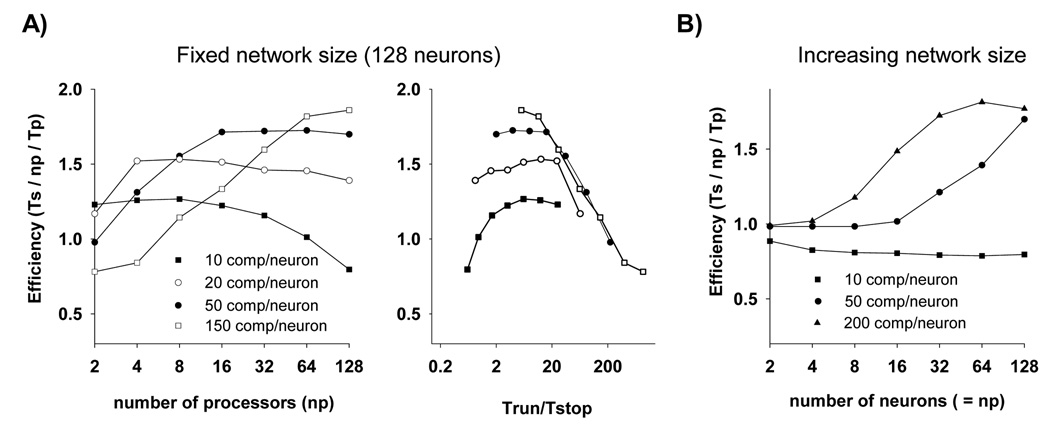
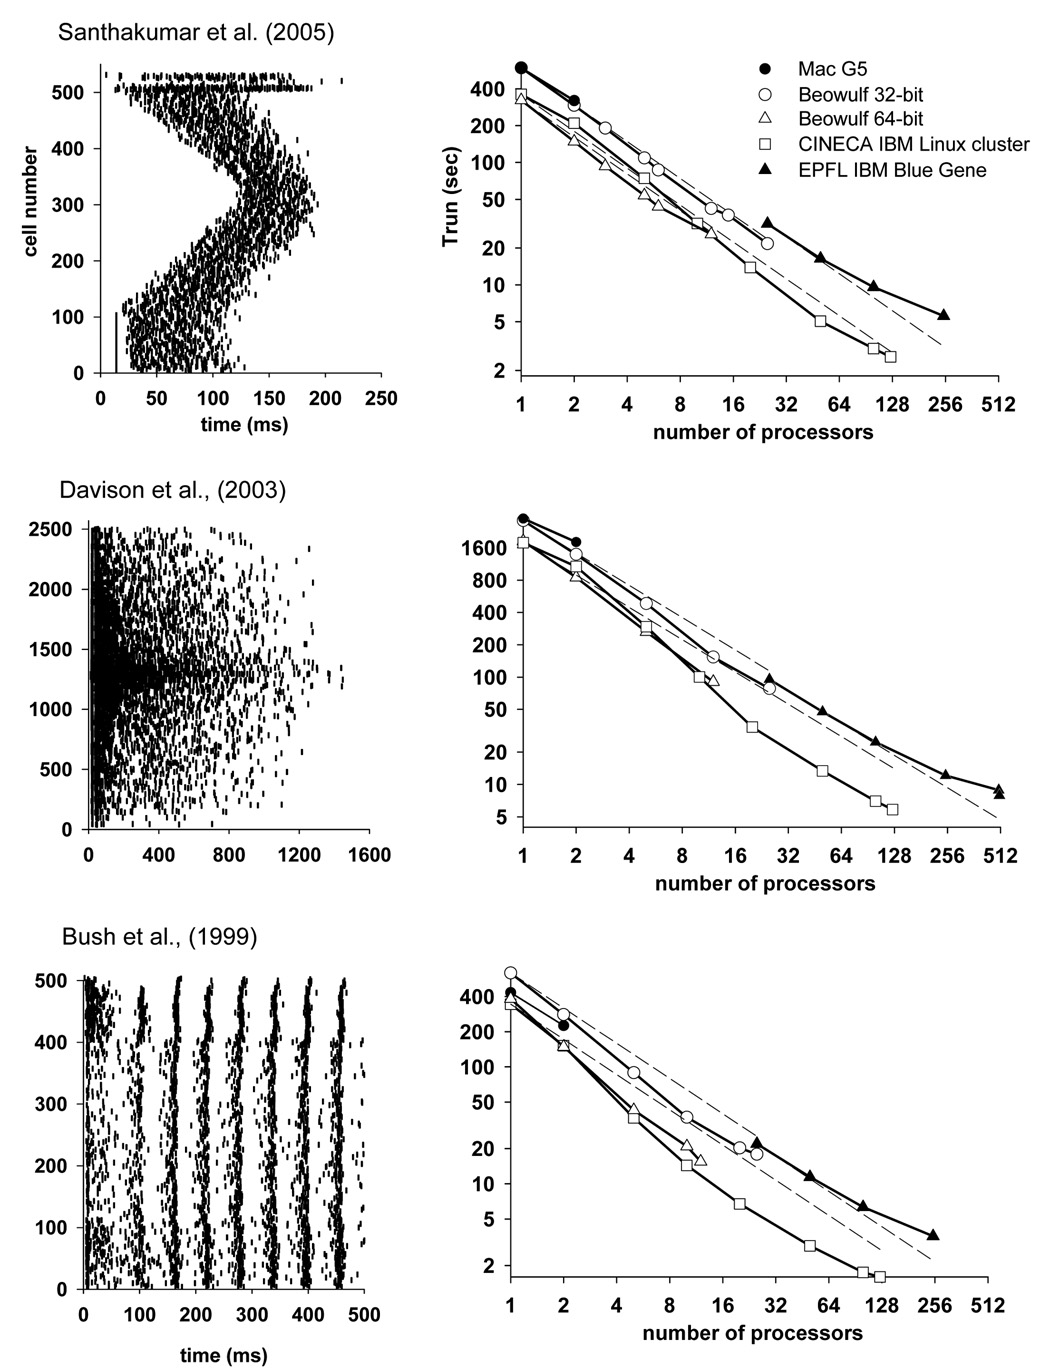
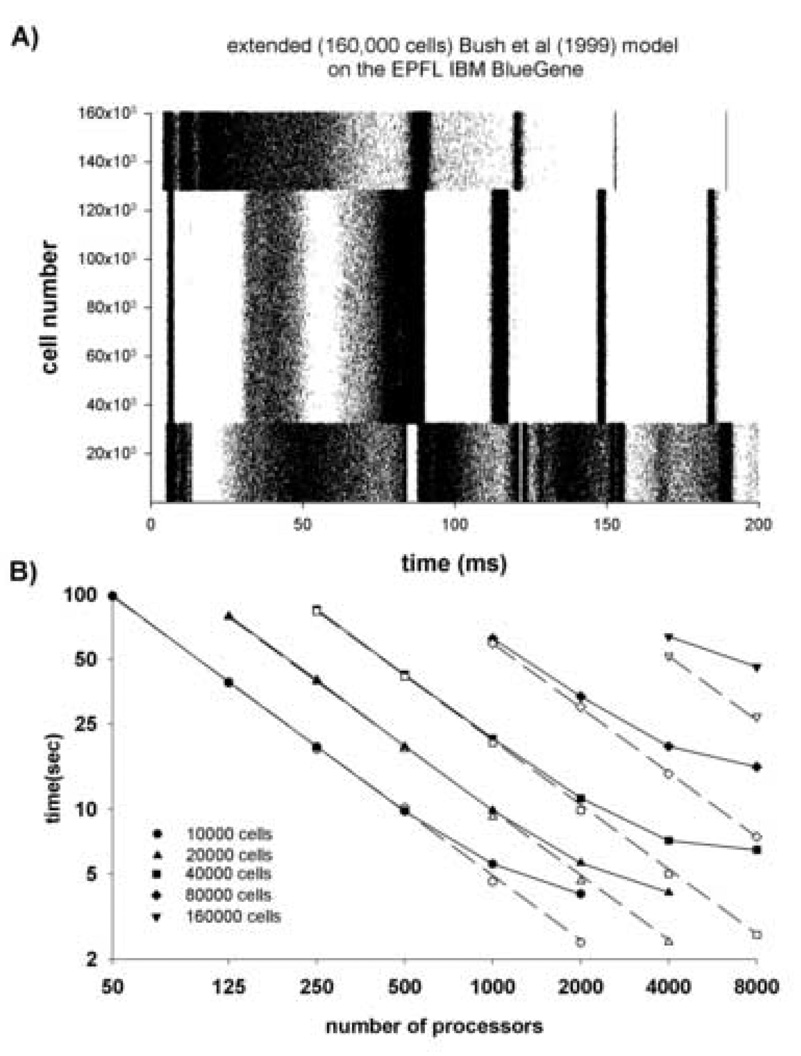
The NEURON simulation environment has been extended to support parallel network simulations. Each processor integrates the equations for its subnet over an interval equal to the minimum (interprocessor) presynaptic spike generation to postsynaptic spike delivery connection delay. The performance of three published network models with very different spike patterns exhibits superlinear speedup on Beowulf clusters and demonstrates that spike communication overhead is often less than the benefit of an increased fraction of the entire problem fitting into high speed cache. On the EPFL IBM Blue Gene, almost linear speedup was obtained up to 100 processors. Increasing one model from 500 to 40,000 realistic cells exhibited almost linear speedup on 2,000 processors, with an integration time of 9.8 seconds and communication time of 1.3 seconds. The potential for speed-ups of several orders of magnitude makes practical the running of large network simulations that could otherwise not be explored.


Figures

Figure 1
Figure 1
Schematic representation of the algorithm used to implement a network of realistic neurons on a parallel system using NEURON.
Figure 2
Figure 2
Performance of the parallel implementation. A) Simulation time for different networks as a function of the number of processors. Dashed lines represent ideal scaling for each case. Circles: simulation time for a network of 128-neuron, 50 compartments/neuron (comp/neuron), running on different numbers of processors; Triangles: simulation time for networks with an increasing number of neurons running on an increasing number of processors (1 neuron/processor). B) Simulation time on a single processor as a function of the number of neurons in a network (circles) using different numbers of comp/neuron. The dashed lines represent the case of ideal scaling and the filled triangles indicate the simulation times for a 4-neuron network with the neurons having a correspondingly larger number of comp/neuron.
Figure 3
Figure 3
A) Efficiency of the parallel implementation for 128-neuron networks having different numbers of compartments/neuron (comp/neuron), as a function of the number of processors (left), or fraction of simulated time, Tstop (right). B) Efficiency of networks of increasing size and different number of comp/neuron; the number of processors used in each simulation (np) was the same as the number of neurons in the network. Ts, simulation time on a single processor; np, number of processors; Tp, simulation time on np processors. In all cases the simulated time was 0.5s.
Figure 4
Figure 4
Parallel implementation of published network models from the ModelDB database. (left) Spike raster plot for each model; (right) Runtime for each model using different parallel systems. In all cases, the dashed lines represent the case of ideal scaling.
Figure 5
Figure 5
Simulations of large networks on the EPFL IBM Blue Gene. A) Spike raster plot of the parallel implementation of an extended version (160,000 cells) of the Bush et al. (1999) model; B) Runtime (filled symbols) and processor computation time (open symbols) as a function of the number of processors used for the model scaled up to various sizes; In all cases, the simulated time was 200ms. Dashed lines represent the ideal scaling for each model size. (Note: the 160k cell simulation was too large to run with 2000 CPUs since only 512 MB are available for each CPU).
Figure 6
Figure 6
Runtime (filled circles) as a function of the number of processors used for 65,536 or 262,144 integrate and fire cells (I&F) using 1000 or 10,000 connections/cell, respectively. The dashed lines represent ideal scaling.

References

    1. Almási G, Heidelberger P, Archer CJ, Martorell X, Erway CC, Moreira JE, Steinmacher-Burow B, Zheng Y. Optimization of MPI collective communication on BlueGene/L systems. Proc. 19th annual international conference on Supercomputing; Cambridge MA. 2005. pp. 253–262.
    1. Bush PC, Prince DA, Miller KD. Increased pyramidal excitability and NMDA conductance can explain posttraumatic epileptogenesis without disinhibition a model. J Neurophysiol. 1999;82:1748–1758. - PubMed
    1. Carriero N, Gelernter D. Linda in context. Communications of the ACM. 1989 Apr; 1989.
    1. Delorme A, Thorpe SJ. SpikeNET: an event-driven simulation package for modelling large networks of spiking neurons Network. 2003;14:613–627. - PubMed
    1. Davison AP, Feng J, Brown D. Dendrodendritic inhibition and simulated odor responses in a detailed olfactory bulb network model. J. Neurophysiol. 2003;90:1921–1935. - PubMed

Publication types

LinkOut - more resources