. 2006 May;2(5):e81.
doi: 10.1371/journal.pgen.0020081. Epub 2006 May 26.

Changes in gene expression foreshadow diet-induced obesity in genetically identical mice

Affiliations

Changes in gene expression foreshadow diet-induced obesity in genetically identical mice

Robert A Koza et al. PLoS Genet. 2006 May.

Abstract

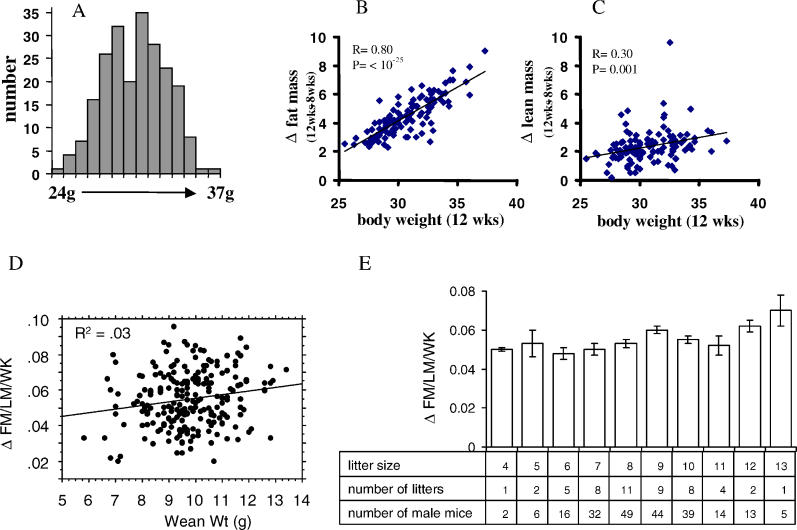
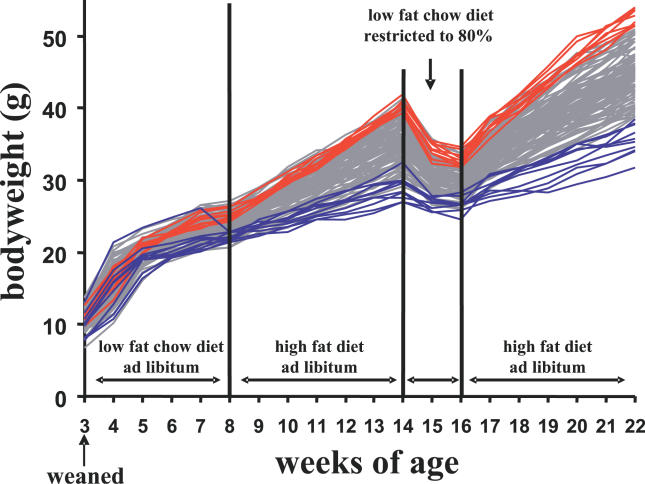
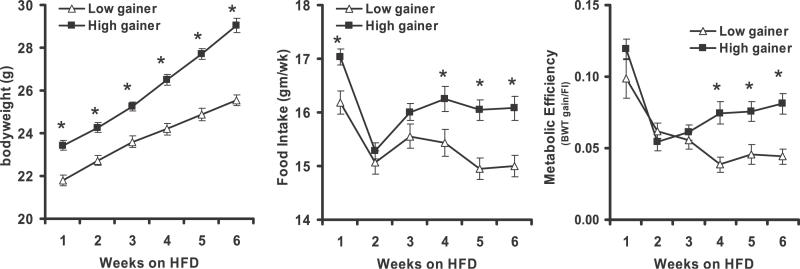
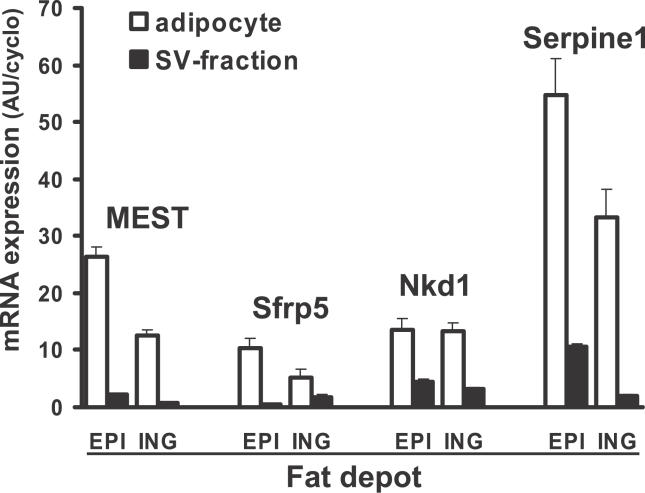
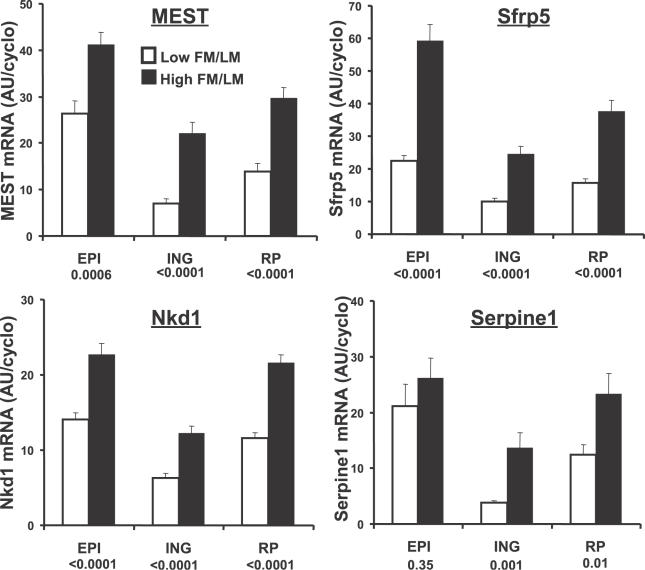
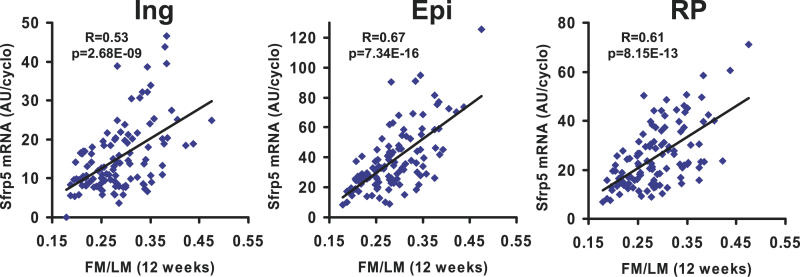
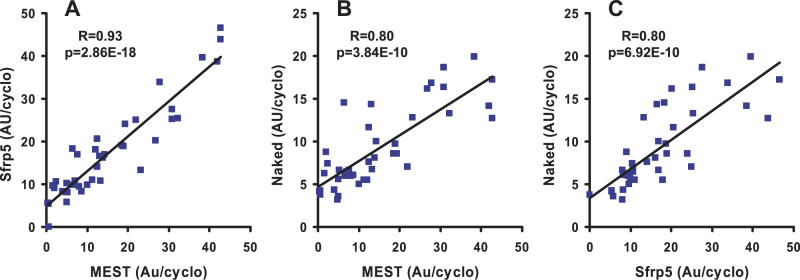
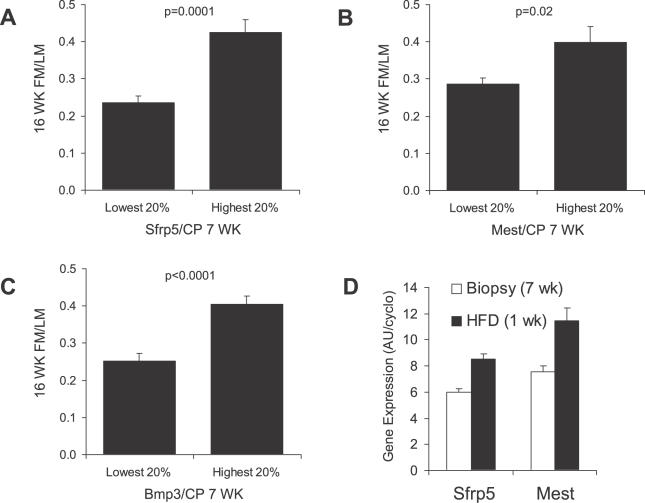
High phenotypic variation in diet-induced obesity in male C57BL/6J inbred mice suggests a molecular model to investigate non-genetic mechanisms of obesity. Feeding mice a high-fat diet beginning at 8 wk of age resulted in a 4-fold difference in adiposity. The phenotypes of mice characteristic of high or low gainers were evident by 6 wk of age, when mice were still on a low-fat diet; they were amplified after being switched to the high-fat diet and persisted even after the obesogenic protocol was interrupted with a calorically restricted, low-fat chow diet. Accordingly, susceptibility to diet-induced obesity in genetically identical mice is a stable phenotype that can be detected in mice shortly after weaning. Chronologically, differences in adiposity preceded those of feeding efficiency and food intake, suggesting that observed difference in leptin secretion is a factor in determining phenotypes related to food intake. Gene expression analyses of adipose tissue and hypothalamus from mice with low and high weight gain, by microarray and qRT-PCR, showed major changes in the expression of genes of Wnt signaling and tissue re-modeling in adipose tissue. In particular, elevated expression of SFRP5, an inhibitor of Wnt signaling, the imprinted gene MEST and BMP3 may be causally linked to fat mass expansion, since differences in gene expression observed in biopsies of epididymal fat at 7 wk of age (before the high-fat diet) correlated with adiposity after 8 wk on a high-fat diet. We propose that C57BL/6J mice have the phenotypic characteristics suitable for a model to investigate epigenetic mechanisms within adipose tissue that underlie diet-induced obesity.


Conflict of interest statement

Competing interests. Dr. Jihad S. Skaf is a paid employee of Applied Biosystems Inc.; his job title is Technical Applications Specialist.

Figures

Figure 1
Figure 1. Establishing Variations in Adiposity in Diet-Induced Obesity in Male C57BL/6J Mice
Frequency distribution of body weight in 219 mice at 12 wk of age, after being fed a high-fat diet for 4 wk. (A) Regression analysis between the change in body weight and fat mass (B) and change in body weight and lean body mass (C) from 8 and 12 wk of age as determined by NMR in 112 mice. (D) Regression analysis between mouse weight at weaning and the percent change of the ratio of fat mass (FM) to lean mass (LM) per week, p = .0105, n = 220. Changes in the FM/LM ratio per wk were calculated from 8–12 wk of age or from 8–14 wk of age. (E) Average percent change of the ratio of FM/LM per week for the various litter sizes, p = .0406, n = 220 (ANOVA).
Figure 2
Figure 2. Stability of the Adiposity Phenotype in B6 Mice
Male mice (n = 107) were fed a low-fat chow diet (Picolab 5053) from weaning to 8 wk of age, a high-fat diet (Research Diets D12331) from 8–14 wk, then the low-fat chow diet, restricted to 80% of the amount consumed from wk 7–8, during wk 15 and16, and finally, the high-fat diet for wk 17–22. Mice were weighed weekly except during the food restriction period when body weights were measured daily until they had stabilized under these conditions. Food intake was measured weekly starting from wk 7. At the end of wk 8, 14, 16, and 22, the body composition of each mouse was analyzed by NMR. The body weight curves of mice at the upper and lower 10% of the frequency distribution at 22 wk of age are plotted in red and blue.
Figure 3
Figure 3. Chronology of Body Weight, Food Intake, and Metabolic Efficiency of Mice with Food Intake Restricted to an Amount Equivalent to That Consumed by 80% of Experimental Mice
Twenty mice were in each group. Differences in phenotype between groups are marked by an asterisk (*) at a significance level of p < 0.01
Figure 4
Figure 4. Comparison of the Expression of Four Genes in the Mature Adipocyte and Stromal Vascular Fraction of the Epididymal and Inguinal Fat Pads Isolated from Four Pools of RNA Derived from Tissue Isolated from Eight Mice
Each pool consisted of equal amounts of RNA from two mice. All comparisons between adipocyte and stromal vascular fractions were significant (p < 0.01) except for ING fat SFRP5 (p = 0.09). EPI = epididymal; ING = Inguinal
Figure 5
Figure 5. Over-Expression of Four Genes in High Gainer Mice in Two Peritoneal Fat Depots and One Subcutaneous Fat Depot Illustrates that the Mechanism Leading to Over-Expression of These Genes Occurs in All Fat Depots
Statistical significance was calculated by ANOVA. Twenty mice were present in each group.
Figure 6
Figure 6. Positive Correlations between SFRP5 and Adiposity
Regression analysis between SFRP5 mRNA levels and adiposity as estimated by the ratio of FM to LM in ING, EPI, and RP fat from 112 Mice Described in Figure 1B. FM = Fat Mass; LM = Lean Mass; ING = Inguinal; EPI = Epididymal; RP = Retroperitoneal
Figure 7
Figure 7. Coordinated Gene Expression
Regression analyses of SFRP5, MEST, and Naked mRNA levels in RNA isolated from high and low gainer mice in inguinal fat depots suggest that regulation of this subset of genes share a common mechanism related to the degree of adiposity. Twenty mice were present in each group.
Figure 8
Figure 8. Analysis of mRNA Levels in Biopsies of Epididymal Fat Depots Taken from Mice 7 wk of Age prior to Feeding a High-Fat Diet Suggests That Changes in Gene Expression Exist before Mice Are Exposed to an Obesogenic Environment
Mean adiposity (FM/LM) at 16 wk of age for the mice with the highest and lowest 20% expression of SFRP5 (A), MEST (B), and BMP3 (C) at 7 wk of age. SFRP5 and MEST were assayed by qRT-PCR and BMP3 by a TaqMan® Low Density Array. Each bar represents the mean FM/LM ± SEM for 12 mice. (D) Induction of SFRP5 and MEST mRNA levels after being fed a high-fat diet at 8 wk of age for 1 wk.

References

    1. Bouchard C, Tremblay A, Despres JP, Nadeau A, Lupien PJ, et al. The response to long-term overfeeding in identical twins. N Engl J Med. 1990;322:1477–1482. - PubMed
    1. Allison DB, Kaprio J, Korkeila M, Koskenvuo M, Neale MC, et al. The heritability of body mass index among an international sample of monozygotic twins reared apart. Int J Obes Relat Metab Disord. 1996;20:501–506. - PubMed
    1. Maes HH, Neale MC, Eaves LJ. Genetic and environmental factors in relative body weight and human adiposity. Behav Genet. 1997;27:325–351. - PubMed
    1. Perusse L, Rankinen T, Zuberi A, Chagnon YC, Weisnagel SJ, et al. The human obesity gene map: The 2004 update. Obes Res. 2005;13:381–490. - PubMed
    1. Stunkard AJ, Harris JR, Pedersen NL, McClearn GE. The body-mass index of twins who have been reared apart. N Engl J Med. 1990;322:1483–1487. - PubMed

Publication types

Substances

Associated data