. 2006 Jun 6;45(22):6987-95.
doi: 10.1021/bi052533w.

Biphasic Ca2+-dependent switching in a calmodulin-IQ domain complex

Affiliations

Biphasic Ca2+-dependent switching in a calmodulin-IQ domain complex

D J Black et al. Biochemistry. .

Abstract

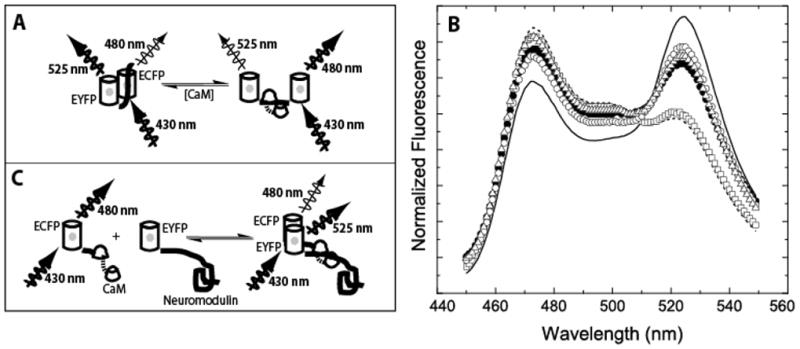
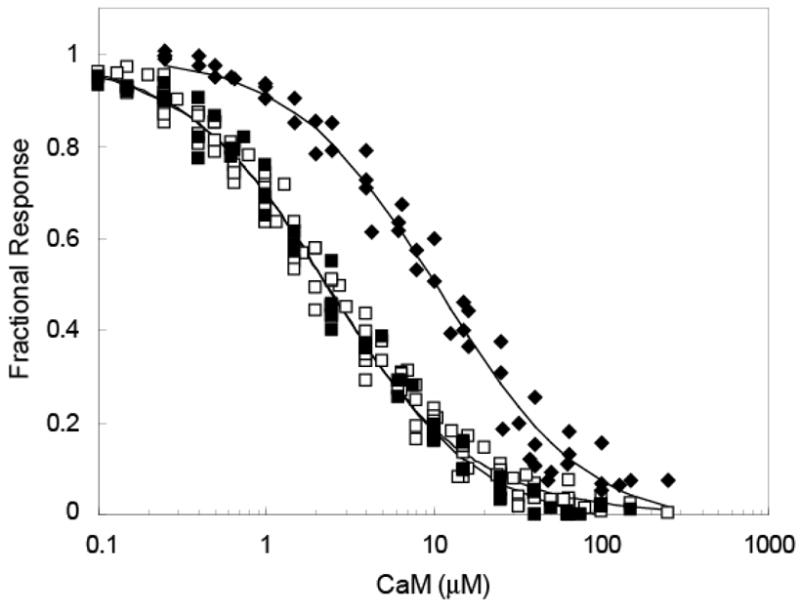
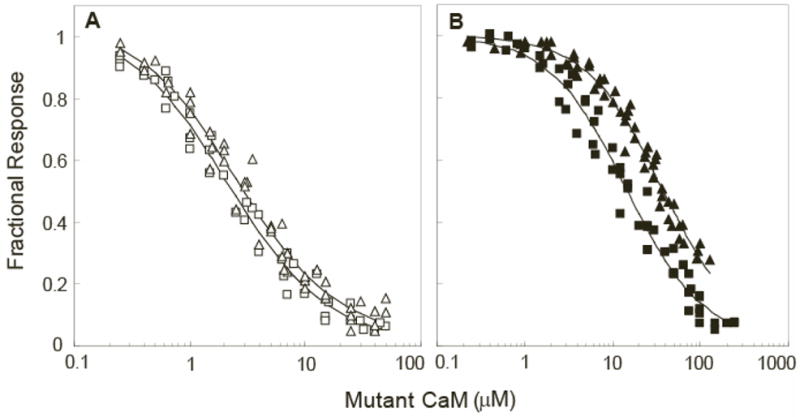
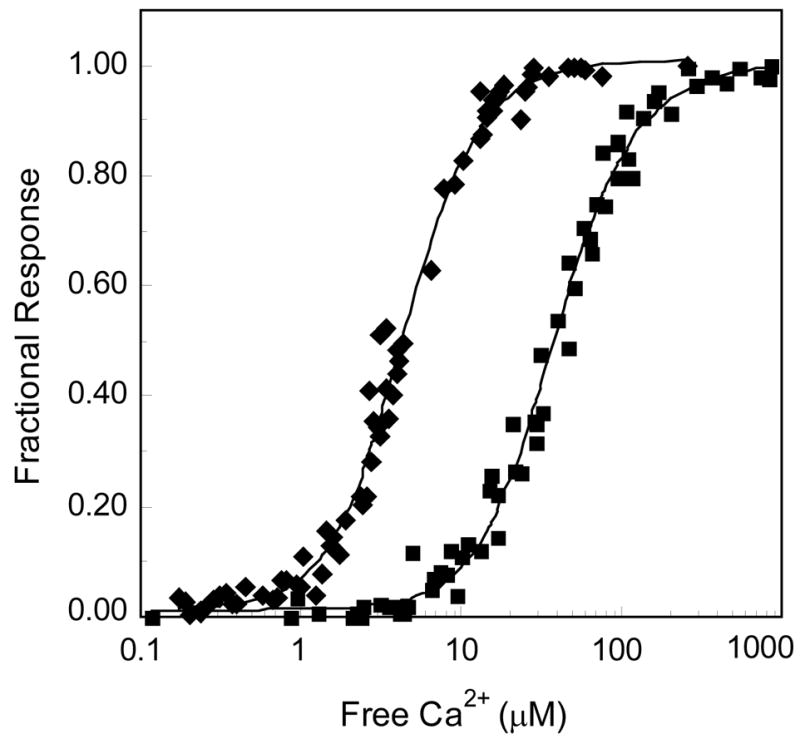
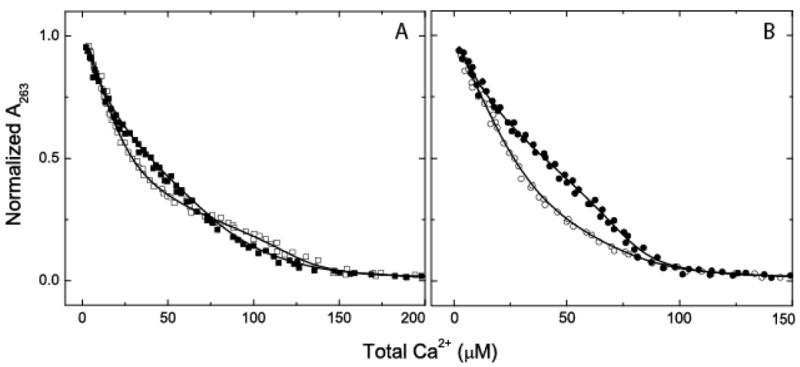
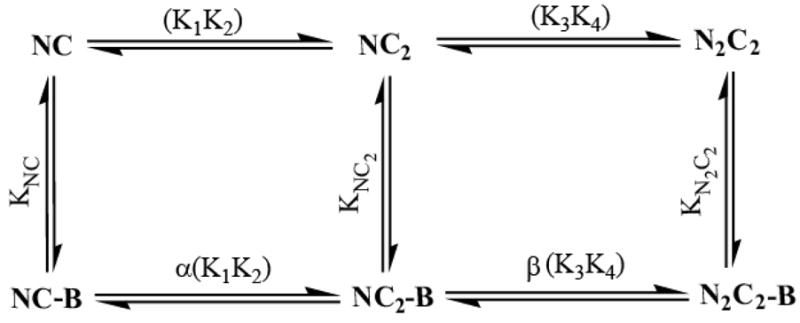
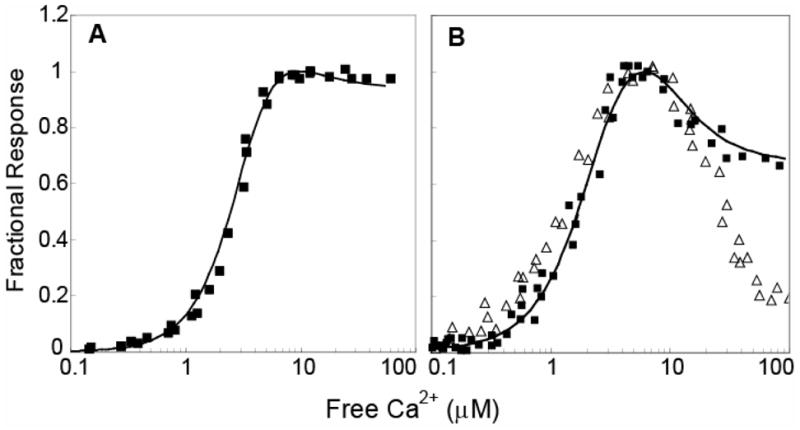
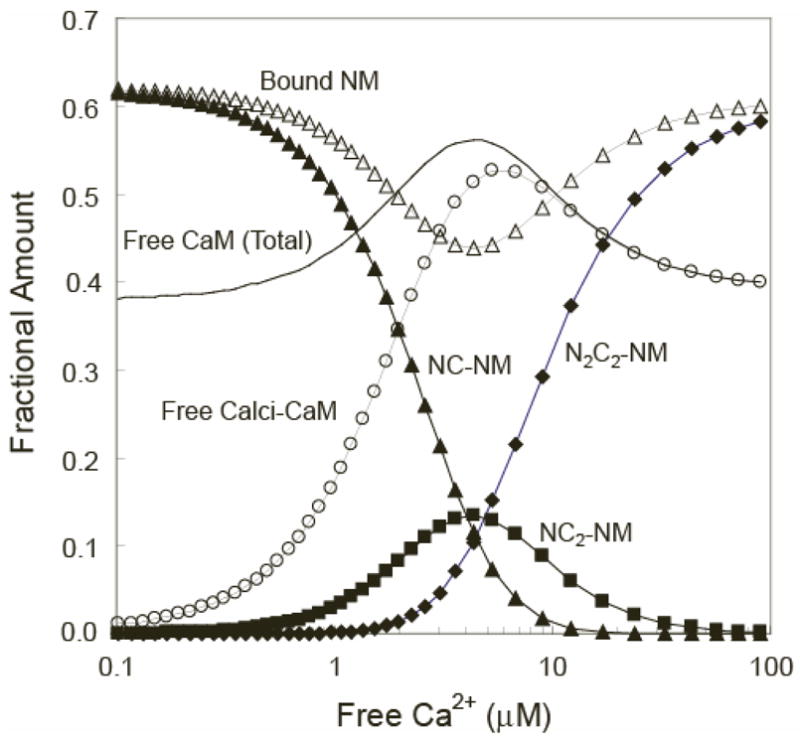
The relationship between the free Ca2+ concentration and the apparent dissociation constant for the complex between calmodulin (CaM) and the neuromodulin IQ domain consists of two phases. In the first phase, Ca2+ bound to the C-ter EF hand pair in CaM increases the Kd for the complex from the Ca2+-free value of 2.3 +/- 0.1 microM to a value of 14.4 +/- 1.3 microM. In the second phase, Ca2+ bound to the N-ter EF hand pair reduces the Kd for the complex to a value of 2.5 +/- 0.1 microM, reversing the effect of the first phase. Due to energy coupling effects associated with these phases, the mean dissociation constant for binding of Ca2+ to the C-ter EF hand pair is increased approximately 3-fold, from 1.8 +/- 0.1 to 5.1 +/- 0.7 microM, and the mean dissociation constant for binding of Ca2+ to the N-ter EF hand pair is decreased by the same factor, from 11.2 +/- 1.0 to 3.5 +/- 0.6 microM. These characteristics produce a bell-shaped relationship between the apparent dissociation constant for the complex and the free Ca2+ concentration, with a distance of 5-6 microM between the midpoints of the rising and falling phases. Release of CaM from the neuromodulin IQ domain therefore appears to be promoted over a relatively narrow range of free Ca2+ concentrations. Our results demonstrate that CaM-IQ domain complexes can function as biphasic Ca2+ switches through opposing effects of Ca2+ bound sequentially to the two EF hand pairs in CaM.


Figures

Fig. 1
Fig. 1. Fluorescent reporter systems used to monitor interactions between CaM and the neuromodulin IQ domain. (A)
BSCaMIQ consists of ECFP and EYFP variants of GFP joined by an IQ domain. When CaM is bound to this domain changes in the orientation and/or distance between the two fluorescent proteins decrease fluorescence resonance energy transfer (FRET) between the ECFP and EYFP components. Thus, under 430 nm excitation ECFP donor fluorescence, measured at 480 nm, is increased and EYFP acceptor fluorescence, measured at 525 nm, is decreased. (B) Complete fluorescence emission spectra for BSCaMIQ under 430 nm excitation. The solid line is the emission spectrum determined in the absence of CaM, the dashed line is the spectrum determined in the presence of a saturating apoCaM concentration. The remaining spectra were determined in the presence of saturating concentrations of Ca2+-free NCxCaM or NxCCaM (□), Ca2+-saturated native CaM (●), NxC2CaM (○) and N2CxCaM (△). (C) A bipartite reporter system consisting of ECFP-CaM and EYFP-neuromodulin fusion proteins. As illustrated in the figure, formation of the complex between CaM and neuromodulin allows FRET between the ECFP and EYFP labels to occur under 430 nm excitation.
Fig. 2
Fig. 2. Binding of CaM to BSCaMIQ in the presence of 10 (◆) and 250 (□) μM free Ca2+, or 3 mM BAPTA (■)
The fractional change in 525 nm fluorescence produced by the decrease in FRET associated with formation of the complex is defined as (Fmax−F)/(Fmax−Fmin), where F corresponds with the emission measured after each addition, and Fmax and Fmin correspond with the emissions of CaM-free and CaM-saturated BSCaMIQ. A 50 μM BSCaMIQ concentration was used for these experiments. The apparent Kd values determined from fits of these data to a simple one-site hyperbolic binding equation (not shown) are listed in Table 1.
Fig. 3
Fig. 3. Binding of NxCCaM or NCxCaM to BSCaMIQ
(A) Fractional changes in 525 nm fluorescence emission, defined as described in the legend to Fig. 2, associated with binding of NxCCaM (□) or NCxCaM (△) to 50 nM BSCaMIQ under nominally Ca2+ free conditions (3 mM BAPTA). (B) Fractional changes in 525 nm fluorescence emission associated with binding of NxCCaM (■) and NCxCaM (▲) to 150 nM BSCaMIQ at a free Ca2+ concentration of ~250 μM. Apparent Kd values derived from the data presented in panels A and B are listed in Table 1.
Fig. 4
Fig. 4. Ca2+-dependent dissociation of the NxCCaM or NCxCaM complexes with BSCaMIQ
Fractional changes in 525 nm fluorescence emission associated with formation of the complexes between 12.5 μM BSCaMIQ and 1 μM NxCCaM (◆) or NCxCaM (■). All free Ca2+ concentrations were verified using indo-5F or mag-indo-1. Fractional changes in fluorescence are defined using an Fmax value measured at the end of the experiment, which accounts for residual CaM binding in the presence of Ca2+. Otherwise fractional changes are defined as described in the legend to Fig. 2. Apparent Ca2+-binding constants derived from fits of these data to equation 2 are listed in Table 2.
Fig. 5
Fig. 5. Direct measurements of Ca2+ binding to native and mutant CaMs in the presence and absence of BSCaMIQ
(A) 263 nm absorbance data for 40 μM dibromo-BAPTA measured in the presence of 20 μM native CaM (■) or 20 μM native CaM and 100 μM BSCaMIQ (□). (B) Absorbance data for 40 μM dibromo-BAPTA measured the presence of 20 μM NxCCaM (●) or 20 μM NxCCaM and 100 μM BSCaMIQ (○). For presentation purposes these data have been normalized to the absorbance of Ca2+-free dibromo-BAPTA determimed at the completion of each titration experiment. Pooled data from 3 separate Ca2+ binding experiments are presented for each set of conditions examined. The dissociation constants derived from fits of these and similar data to equation 3 or 4 are listed in Table 2 (28).
Fig. 6
Fig. 6. A general four-state scheme for Ca2+-dependent switching in a CaM-IQ domain complex
B indicates the bound IQ domain protein; N and C indicate the N-ter and C-ter EF hand pairs in CaM, with subscripts denoting their Ca2+-liganded states; the absence of a subscript indicates a Ca2+-free EF hand pair.
Fig. 7
Fig. 7. Minimal scheme for Ca2+-dependent switching in the neuromodulin CaM-IQ domain complex
Ca2+ binding via the N-ter→C-ter pathway depicted in the general scheme appears to be strongly disfavored, so it can be omitted from the minimal scheme describing the Ca2+-dependence of the CaM-neuromodulin complex under steady-state conditions.
Fig. 8
Fig. 8. The relationship between the free Ca2+-concentration and the dissociation constant for the complex between CaM and the neuromodulin IQ domain is bell shaped
All free Ca2+ concentrations were verified using indo-5F or mag-indo-1. (A) The fractional fluorescence response of 250 nM BSCaMIQ in the presence of 20 μM CaM (B) The fractional fluorescence response of 5 μM BSCaMIQ in the presence of 1 μM CaM (■), and the fractional response of a solution of 1 μM ECFP-CaM and 5 μM EYFP-neuromodulin (△). Because FRET increases when this complex is formed, the fractional response in this case defined as (F−Fmin)/(Fmax−Fmin). The curves in both panels were calculated as described under “Materials and Methods” according to the scheme depicted in Fig. 7. The Fmin/Fmax values used to generate for these curves were adjusted slightly to achieve the fits shown. All adjusted values were within 3% of the mean values given in Table 1.
Fig. 9
Fig. 9. Various species produced in a solution of neuromodulin (NM) and CaM as a function of the free Ca2+ concentration
Calculations were performed as described under “Materials and Methods” using CaM and NM concentrations of 10 μM based on the scheme depicted in Fig. 7. All calculated concentrations are expressed relative to the total CaM concentration. Curves correspond with the relative concentrations of bound NM (△), total free CaM (no symbol), free calci-CaM (○), NCCaM-NM complex (▲), NC2CaM-NM complex (■), and N2C2CaM-NM complex (◆). Calci-CaM refers to the total of all free Ca2+-liganded CaM species, which primarily consist of NC2CaM and N2C2-CaM. Otherwise, the nomenclature for the various Ca2+-liganded species of CaM is given in the legend to Table 1.

References

    1. Yagi K, Yazawa M, Kakiuchi S, Ohshima M, Uenishi K. Identification of an activator protein for myosin light chain kinase as the Ca2+-dependent modulator protein. J Biol Chem. 1978;253:1338–1340. - PubMed
    1. Bredt DS, Snyder SH. Isolation of nitric oxide synthetase, a calmodulin-requiring enzyme. Proc Nat Acad Sci USA. 1990;87:682–685. - PMC - PubMed
    1. Venema RC, Sayegh HS, Arnal JF, Harrison DG. Role of the enzyme calmodulin-binding domain in membrane association and phospholipid inhibition of endothelial nitric oxide synthase. J Biol Chem. 1995;270:14705–14711. - PubMed
    1. Dabrowska R, Sherry JM, Aromatorio DK, Hartshorne DJ. Modulator protein as a component of the myosin light chain kinase from chicken gizzard. Biochemistry. 1978;17:253–258. - PubMed
    1. Jurado LA, Chockalingam PS, Jarrett HW. Apocalmodulin. Physiol Rev. 1999;79:661–682. - PubMed

Publication types