. 2006 May 30:7:272.
doi: 10.1186/1471-2105-7-272.

Epigenetic acquisition of inducibility of type III cytotoxicity in P. aeruginosa

Affiliations

Epigenetic acquisition of inducibility of type III cytotoxicity in P. aeruginosa

Didier Filopon et al. BMC Bioinformatics. .

Abstract

Background: Pseudomonas aeruginosa, an opportunistic pathogen, is often encountered in chronic lung diseases such as cystic fibrosis or chronic obstructive pneumonia, as well as acute settings like mechanical ventilation acquired pneumonia or neutropenic patients. It is a major cause of mortality and morbidity in these diseases. In lungs, P. aeruginosa settles in a biofilm mode of growth with the secretion of exopolysaccharides in which it is encapsulated, enhancing its antibiotic resistance and contributing to the respiratory deficiency of patients. However, bacteria must first multiply to a high density and display a cytotoxic phenotype to avoid the host's defences. A virulence determinant implicated in this step of infection is the type III secretion system (TTSS), allowing toxin injection directly into host cells. At the beginning of the infection, most strains isolated from patients' lungs possess an inducible TTSS allowing toxins injection or secretion upon in vivo or in vitro activation signals. As the infection persists most of the bacteria permanently loose this capacity, although no mutations have been evidenced. We name "non inducible" this phenotype. As suggested by the presence of a positive feedback circuit in the regulatory network controlling TTSS expression, it may be due to an epigenetic switch allowing heritable phenotypic modifications without genotype's mutations.

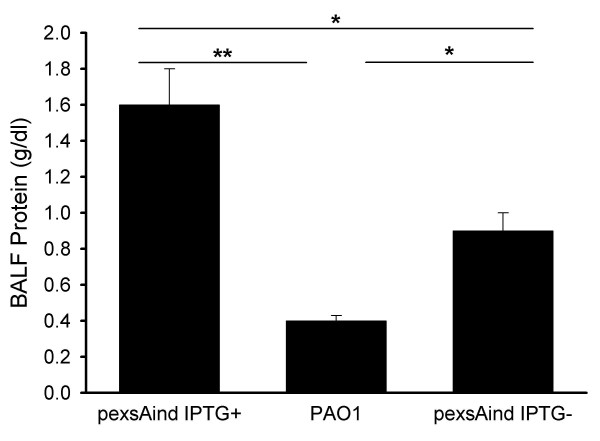
Results: Using the generalised logical method, we designed a minimal model of the TTSS regulatory network that could support the epigenetic hypothesis, and studied its dynamics which helped to define a discriminating experimental scenario sufficient to validate the epigenetic hypothesis. A mathematical framework based on formal methods from computer science allowed a rigorous validation and certification of parameters of this model leading to epigenetic behaviour. Then, we demonstrated that a non inducible strain of P. aeruginosa can stably acquire the capacity to be induced by calcium depletion for the TTSS after a short pulse of a regulatory protein. Finally, the increased cytotoxicity of a strain after this epigenetic switch was demonstrated in vivo in an acute pulmonary infection model.

Conclusion: These results may offer new perspectives for therapeutic strategies to prevent lethal infections by P. aeruginosa by reverting the epigenetic inducibility of type III cytotoxicity.


Figures

Figure 1
Figure 1
Models of the Regulation of the TTSS. (A) The regulatory network of the type III secretion system. Regulators encoded outside of the ExsA regulon are not shown. Filled arrows and dashed lines represent positive or negative interactions respectively, dotted lines stand for transcription and translation, opened arrows represent the secretion of proteins. (B) The molecular sub-network drawn here only shows interactions involved in feedback circuits: autoregulation of exsA, activation by ExsA of the operons involved in the cytotoxic response, and the inhibition of ExsA by ExsD. Induction of secretion and expression of cytotoxicity by the target, or by calcium depletion, is considered constant and is therefore not indicated. Other regulations of the exsA gene are not represented. (C) The minimal regulatory graph extracted from the molecular graph. The three variables are x = ExsA, y = ExsD (the ExsA inhibitor), and z = type III secretory apparatus and toxin secretion. The four arrows represent autoregulation of the exsA gene (x→x), transcriptional activation of the exsD gene by protein ExsA (x→y), transcriptional activation of the genes involved in type III secretory system (x→z), and inhibition of ExsA by ExsD (y→x).
Figure 2
Figure 2
Underlying dynamics depend on the values of interactions thresholds and on the parameters values. The labels of the vertices indicate the sign of the interaction and its threshold. As these thresholds are almost always unknown, value 1 means only that the corresponding threshold is the lowest one, and value 2 that it is the second lowest threshold. Two different graphs must then be drawn depending on which promoter is more sensitive to ExsA. (A) In this case, the threshold above which x is active on x is higher (level 2) than that above which it is active on y (level 1). (B) Represents the reverse case. z is an output element whose level is determined by the value of x: low values of x will lead to negligible amounts of z, while high values of x will lead to high levels of z.
Figure 3
Figure 3
One result from SMBioNet in accordance with the epigenetic hypothesis of the regulatory graph. SMBioNet provides a graphical interface that allows the user to define a regulatory graph and to edit temporal properties. SMBioNet exhibits all sets of parameters which satisfy the properties. Consistency is thus established if and only if at least one set of parameters is selected by SMBioNet. (A) Parameter table. The two first columns list all possible states of the network according to genes x and y. The third column gives the Kx, w parameters which define the expression level towards which x tends to evolve. Note that w represents all the positive regulatory effects that are active on x (including the lack of active negative effects). Here, w reflects the effects of x, if its value is higher than the activity thresholds indicated in the graph, and the effects of y, if its value is lower than the activity threshold. The fourth column similarly gives the Ky, w parameters which define the expression level towards which y tends to evolve. (B) State transition graph. The dynamics of the model are deduced from the values of the parameters via a desynchronisation algorithm[21].
Figure 4
Figure 4
Secretion profiles of various P. aeruginosa strains induced for type III secretion. Coomassie blue-stained SDS-PAGE of TTSS secreted proteins. ExoS and ExoT toxins, the most abundant type III-related exoproducts[3], are indicated on the right side of the gel. IPTG was used at 1 mM. Under corresponding lanes are given the mean values (± SE) of the relative exsA mRNA production compared with the one of PAO1 (set to 1), measured by real time PCR in the same conditions. (A) Lane 1, CHA; lane 2, PAO1; lanes 3 and 4, PAO1 (pexsAind) without or with a 20 min IPTG pulse; lane 5, PAO1 ExsA-; lanes 6 and 7, PAO1 ExsA- (pexsAind) without or with a 20-min IPTG pulse; lane 8, PAO1 ExsA- (pexsAind) with a 20 min IPTG pulse and with IPTG during the calcium depletion. (B) PAO1 (pexsAind) was pulsed or not with 1 mM IPTG during 20 min then washed with fresh LB. Next, bacteria were maintained in exponential phase of growth by serial dilution with fresh medium during a definite time before calcium depletion as indicated below the gel.
Figure 5
Figure 5
Epigenetic acquisition of in vivo type III cytotoxicity. Protein levels measured in the bronchoalveolar lavage fluid (BALF) in the three experimental groups: PAO1 pexsAind (108 CFU/ml) with 1 mM IPTG Pulse (pexsAind ITPG+) or not (pexsAind IPTG-), PAO1 (108 CFU/ml). Proteins levels are significantly different between each group. *p < 0.01, **p < 0.0001. Results are expressed as mean ± SE.

Similar articles

Cited by

References

    1. Govan JR, Harris GS. Pseudomonas aeruginosa and cystic fibrosis: unusual bacterial adaptation and pathogenesis. Microbiol Sci. 1986;3:302–308. - PubMed
    1. Hueck CJ. Type III protein secretion systems in bacterial pathogens of animals and plants. Microbiol Mol Biol Rev. 1998;62:379–433. - PMC - PubMed
    1. Frank DW. The exoenzyme S regulon of Pseudomonas aeruginosa. Mol Microbiol. 1997;26:621–629. doi: 10.1046/j.1365-2958.1997.6251991.x. - DOI - PubMed
    1. McCaw ML, Lykken GL, Singh PK, Yahr TL. ExsD is a negative regulator of the Pseudomonas aeruginosa type III secretion regulon. Mol Microbiol. 2002;46:1123–1133. doi: 10.1046/j.1365-2958.2002.03228.x. - DOI - PubMed
    1. Dasgupta N, Lykken GL, Wolfgang MC, Yahr TL. A novel anti-anti-activator mechanism regulates expression of the Pseudomonas aeruginosa type III secretion system. Mol Microbiol. 2004;53:297–308. doi: 10.1111/j.1365-2958.2004.04128.x. - DOI - PubMed

Publication types

Substances