. 2006 Jun 6;103(23):8870-5.
doi: 10.1073/pnas.0603376103. Epub 2006 May 30.

Polarized axonal surface expression of neuronal KCNQ channels is mediated by multiple signals in the KCNQ2 and KCNQ3 C-terminal domains

Affiliations

Polarized axonal surface expression of neuronal KCNQ channels is mediated by multiple signals in the KCNQ2 and KCNQ3 C-terminal domains

Hee Jung Chung et al. Proc Natl Acad Sci U S A. .

Abstract

The M channels, important regulators of neuronal excitability, are voltage-gated potassium channels composed of KCNQ2-5 subunits. Mutations in KCNQ2 and KCNQ3 cause benign familial neonatal convulsions (BFNC), dominantly inherited epilepsy and myokymia. Crucial for their functions in controlling neuronal excitability, the M channels must be placed at specific regions of the neuronal membrane. However, the precise distribution of surface KCNQ channels is not known. Here, we show that KCNQ2/KCNQ3 channels are preferentially localized to the surface of axons both at the axonal initial segment and more distally. Whereas axonal initial segment targeting of surface KCNQ channels is mediated by ankyrin-G binding motifs of KCNQ2 and KCNQ3, sequences mediating targeting to more distal portion of the axon reside in the membrane proximal and A domains of the KCNQ2 C-terminal tail. We further show that several BFNC mutations of KCNQ2 and KCNQ3 disrupt surface expression or polarized surface distribution of KCNQ channels, thereby revealing impaired targeting of KCNQ channels to axonal surfaces as a BFNC etiology.


Conflict of interest statement

Conflict of interest statement: No conflicts declared.

Figures
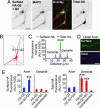
Fig. 1
Fig. 1
KCNQ2 and KCNQ3 localize preferentially on the axonal surface. Hippocampal neurons (10 DIV) transfected with HA-KCNQ2 and KCNQ3 were immunostained first with mouse anti-HA antibody before permeabilization (surface HA) and then rat anti-HA antibody (total HA) and dendritic marker anti-MAP2 antibody (MAP2) after permeabilization. (A) Preferential localization of HA-KCNQ2/KCNQ3 on the axonal surface. Arrows mark the main axon. (C) Immunofluorescence intensity profiles of surface and total HA along a 40-μm line in Fig. 1A, as marked in the camera lucida drawing (B). (D) Surface and total HA-KCNQ2/KCNQ3 in distal axons. (E) Background subtracted, mean intensity of the surface HA and total HA fluorescence in major dendrites and axons. Coexpression of HA-KCNQ2 and KCNQ3 (n = 16) increased surface expression in axons but not dendrites compared with transfection of HA-KCNQ2 alone (n = 8; ∗∗∗, P < 0.001). AU, arbitrary unit. (Scale bars: 40 μm.)
Fig. 2
Fig. 2
Enrichment of KCNQ2 and KCNQ3 on the AIS surface. (A and B) The Nav channels, which localize to the AIS, show overlapping distribution with surface HA-KCNQ2/KCNQ3 (A) and HA-KCNQ3/KCNQ2 (B) in hippocampal neurons (DIV 10). (Scale bars: 20 μm.) (C) The axonal versus dendritic surface fluorescence (axon/dendrite) ratio revealing polarized axonal distribution of surface HA-KCNQ2/KCNQ3 (n = 22; ∗∗, P < 0.01) and HA-KCNQ3/KCNQ2 (n = 12; ∗, P < 0.05) channels compared with unpolarized CD4 (n = 11). (D) The AIS versus distal axon surface fluorescence (AIS/distal axon) ratio revealing the concentration of surface HA-KCNQ2/KCNQ3 (n = 22; ∗∗, P < 0.01) and HA-KCNQ3/KCNQ2 (n = 12; ∗, P < 0.05) but not HA-Kv1.2 (n = 14) proteins at the AIS, where Nav channels are enriched (n = 33; ∗∗∗, P < 0.001).
Fig. 3
Fig. 3
Mutation of ankyrin-G binding motifs abolishes AIS concentration of surface KCNQ channels. (A and B) Mutations of ankyrin-G binding motifs in both subunits (E810A/D812A for KCNQ2 and E837A/D839A for KCNQ3) completely abolished AIS enrichment (A) and halved the axonal surface expression (B) of HA-KCNQ2/KCNQ3 channels (n = 13; ∗∗, P < 0.01). AIS mutations had no effect on the surface and total expression in dendrites (∗∗∗, P < 0.001 compared to untransfected). Arrows mark the beginning of the main axon. (Scale bars: 20 μm.) (C) Mutations of ankyrin G binding motifs in both subunits completely abolished AIS enrichment and partially impaired axonal polarity of HA-KCNQ2/KCNQ3 (AIS/distal axon; ∗∗, P < 0.01; axon/dendrite; ∗, P < 0.05).
Fig. 4
Fig. 4
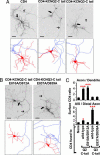
Fusion of KCNQ2 C-terminal tail (C-tail) targets CD4 to axonal and AIS surface, whereas fusion of KCNQ3 C-tail concentrates CD4 to the AIS. (A and B) Surface immunostaining of hippocampal neurons (DIV 10) transfected with CD4, CD4-KCNQ2 C-tail with or without mutation of ankyrin-G binding motif (E810A/D812A), and CD4-KCNQ3 C-tail with or without mutation of ankyrin-G binding motif (E837A/D839A) (Upper). Camera lucida drawings (Lower) of the neurons from Upper show MAP2-positive dendrites (red) and MAP2-negative axons (blue). Thin arrows show the main axonal branches, whereas thick arrows show the AIS. (Scale bars: 40 μm.) (C) The axon/dendrite ratio shows nonpolarized CD4 (n = 15), axonal targeting of CD4 fused with KCNQ2 C-tail wild-type (n = 19; ∗∗∗, P < 0.001) or a KCNQ2 C-tail with the E810A/D812A mutation (n = 10; ∗∗∗, P < 0.001), but not KCNQ3 C-tail (n = 30; P > 0.05) or a KCNQ3 C-tail with E837A/D839A mutation (n = 12; P > 0.05). The AIS/distal axon ratio revealing AIS enrichment of CD4 fused to KCNQ2 C-tail (∗, P < 0.05) or KCNQ3 C-tail (∗∗∗, P < 0.001) but not either C-tail with mutated ankyrin-G binding motif (P > 0.05).
Fig. 5
Fig. 5
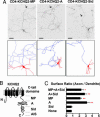
Fusion of A domain or membrane proximal-domain of KCNQ2 targets CD4 to axonal surface. (A) Surface immunostaining of hippocampal neurons (DIV 10) transfected with CD4 fused to different regions of KCNQ2 C-tail (Upper). Camera lucida drawings (A Lower) of the neurons from A Upper show MAP2-positive dendrites (red) and MAP2-negative axons (blue). Arrows show the main axonal branches. (Scale bars: 40 μm.) (B) Schematic drawing (not to scale) of KCNQ2 subunit showing four distinct regions of C-tail: membrane proximal domain (MP; amino acids 323–500), A domain (A; amino acids 501–579), subunit interaction domain (Sid, amino acids 580–623), and ankyrin-G binding domain (AIS; amino acids 624–844). (C) The axon/dendrite ratio revealing the conversion of nonpolarized CD4 distribution (n = 15) to polarized axonal surface expression of CD4 fused to KCNQ2 MP+A+ Sid (n = 14; ∗, P < 0.05), A+Sid (n = 15; ∗∗, P < 0.01), MP (n = 22; ∗∗, P < 0.01), and A (n = 28; ∗∗, P < 0.01) but not to the Sid domain (n = 19; P > 0.05).
Fig. 6
Fig. 6
Certain BFNC mutations disrupt polarized axonal surface expression of heteromeric KCNQ2/3 channels. (A) Schematic drawing (not to scale) of KCNQ2 with various BFNC mutations: C-terminal frameshift mutations replacing distal C-termini with completely different peptide sequences (P681-FS and G838-FS), C-terminal truncation (Q323X and Y534X), a missense mutation in C-terminal A-domain (K526N), and missense mutations in the pore and the sixth transmembrane segment (Y284C and A306T). (B) The axon/dendrite ratio was decreased by K526N (∗, P < 0.05), Y284C (∗∗∗, P < 0.001), A306T (∗∗∗, P < 0.001) but not G838-FS mutation (P > 0.05), whereas the AIS/distal axon ratio was increased by K526N mutation (∗∗∗, P < 0.001). Both the axon/dendrite and AIS/distal axon ratios were decreased to 1 by P681-FS, Q323X, and Y534X mutation. (C) Axonal surface expression of HA-KCNQ3/KCNQ2 channels was abolished by P681-FS (n = 22), Q323X (n = 10), and Y534X mutation (n = 9; ∗∗∗, P < 0.001). It is reduced by Y284C (n = 12; ∗∗∗, P < 0.001), A306T (n = 16; ∗∗∗, P < 0.001), K526N (n = 25; ∗∗∗, P < 0.001), and G838-FS mutation (n = 8; ∗, P < 0.05) compared with wild-type (n = 44). The total expression in axon was decreased by K526N (∗∗, P < 0.01), Y534X (∗, P < 0.05) and A306T mutation (∗∗∗, P < 0.001). The total expression in dendrite was decreased by A306T mutation (P < 0.05) but increased by P681-FS mutation (∗∗, P < 0.01). Dendritic surface expression was unaffected by these mutations (P > 0.05). (D) Schematic drawing (not to scale) of KCNQ3 with a missense mutation in the pore region (G310V). (E) The KCNQ3 G310V mutation (n = 13) reduced surface (∗∗∗, P < 0.001) and total expression (∗, P < 0.05) of HA-KCNQ2/KCNQ3 in axons, and dendritic total expression (∗∗∗, P < 0.001) compared with wild type (n = 24). (F) The axon/dendrite ratio but not the AIS/distal axon ratio was decreased by G310V mutation (∗∗, P < 0.01). AU, arbitrary unit.

References

    1. Jentsch T. J. Nat. Rev. Neurosci. 2000;1:21–30. - PubMed
    1. Brown B. S., Yu S. P. Prog. Biophys. Mol. Biol. 2000;73:135–166. - PubMed
    1. Wang H. S., Pan Z., Shi W., Brown B. S., Wymore R. S., Cohen I. S., Dixon J. E., McKinnon D. Science. 1998;282:1890–1893. - PubMed
    1. Shah M. M., Mistry M., Marsh S. J., Brown D. A., Delmas P. J. Physiol. 2002;544:29–37. - PMC - PubMed
    1. Cooper E. C., Aldape K. D., Abosch A., Barbaro N. M., Berger M. S., Peacock W. S., Jan Y. N., Jan L. Y. Proc. Natl. Acad. Sci. USA. 2000;97:4914–4919. - PMC - PubMed

Publication types