. 2006 Sep 15;108(6):2055-63.
doi: 10.1182/blood-2006-04-016444. Epub 2006 May 30.

Kinin receptor expression during Staphylococcus aureus infection

Affiliations

Kinin receptor expression during Staphylococcus aureus infection

Sara H Bengtson et al. Blood. .

Abstract

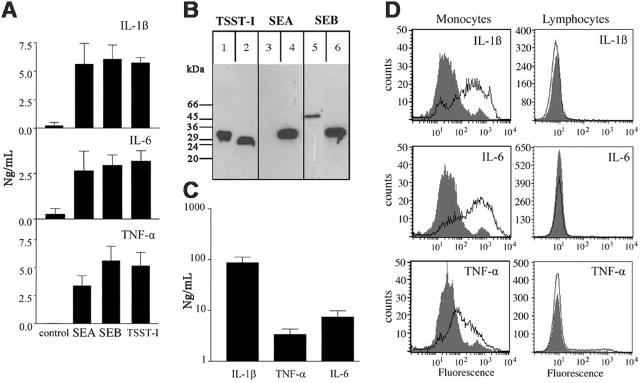
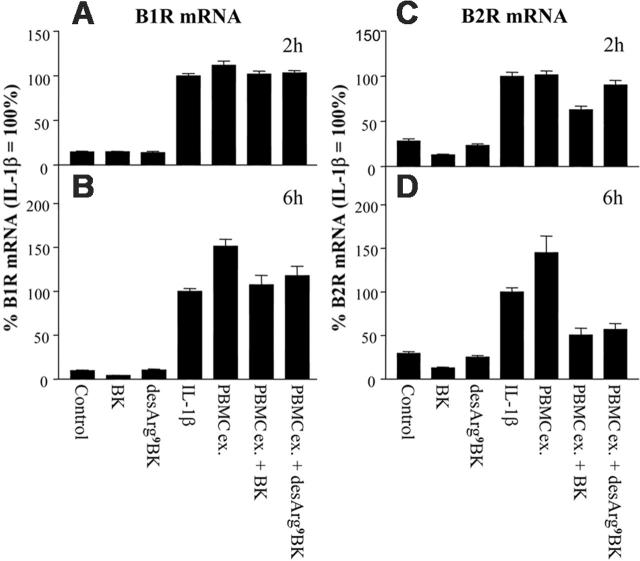
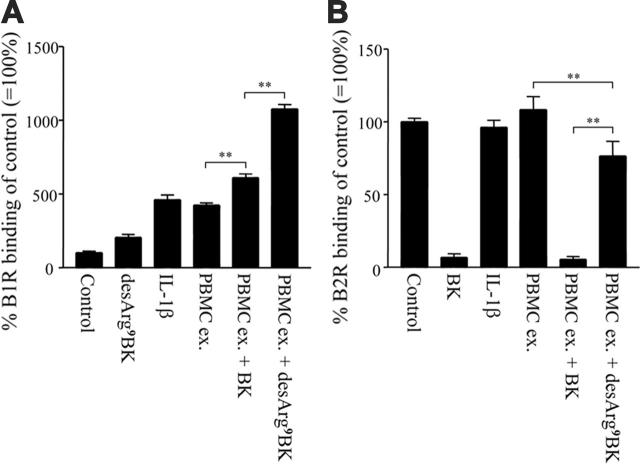
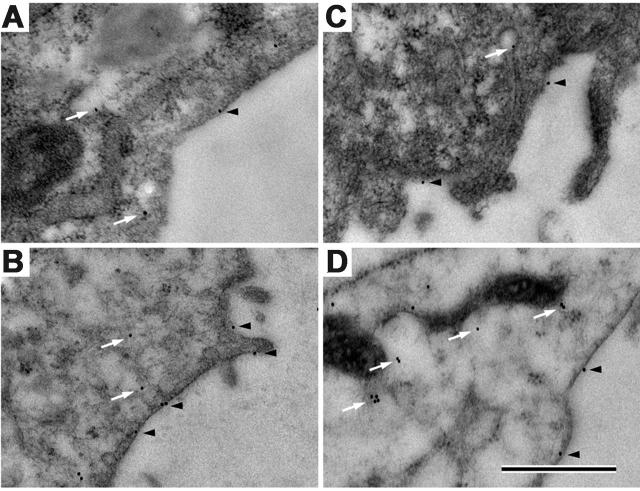
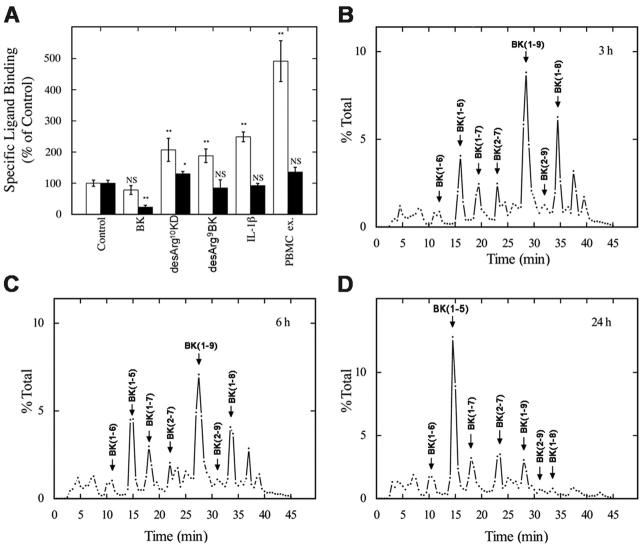
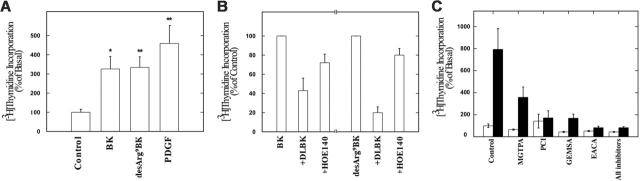
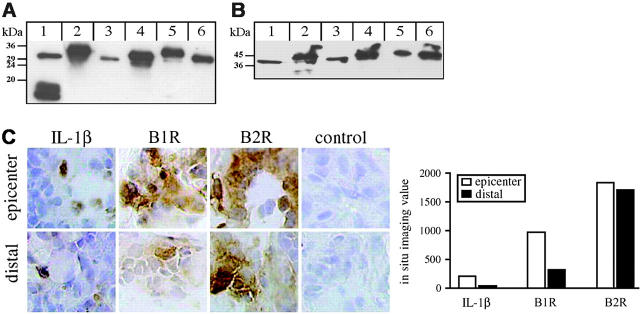
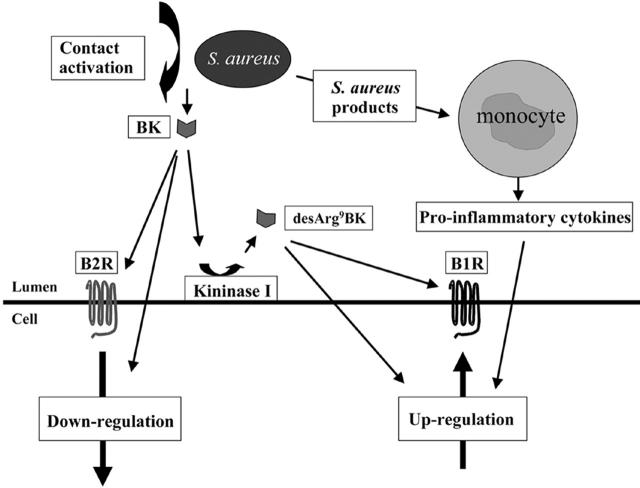
An inappropriate host response to invading bacteria is a critical parameter that often aggravates the outcome of an infection. Staphylococcus aureus is a major human Gram-positive pathogen that causes a wide array of community- and hospital-acquired diseases ranging from superficial skin infections to severe conditions such as staphylococcal toxic shock. Here we find that S aureus induces inflammatory reactions by modulating the expression and response of the B1 and B2 receptors, respectively. This process is initiated by a chain of events, involving staphylococcal-induced cytokine release from monocytes, bacteria-triggered contact activation, and conversion of bradykinin to its metabolite desArg(9)bradykinin. The data of the present study implicate an important and previously unknown role for kinin receptor regulation in S aureus infections.


Figures

Figure 1.
Figure 1.
Secretion of proinflammatory cytokines from human peripheral monocytes following stimulation with superantigens from S aureus. (A) Human PBMCs were treated for 24 hours with 100 ng/mL staphylococcal enterotoxin A (SEA), staphylococcal enterotoxin B (SEB), toxic shock syndrome toxin I (TSST-I), or culture media alone. PBMC exudates were collected and analyzed for their IL-1β, IL-6, and TNF-α content by ELISA. Results show mean values ± SD of 3 independent experiments for each cytokine. (B) Supernatants from an overnight culture of S aureus Wood strain 46 were run on SDS-PAGE. Separated proteins were transferred onto nitrocellulose membranes and probed with antibodies against TSST-I (lanes 1), SEA (lane 3), or SEB (lane 5). Purified toxins were used as controls (lanes 2, 4, and 6). Bound antibodies were detected by peroxidase-conjugated secondary antibodies against rabbit immunoglobulin. It should be noted that size heterogeneity for staphylococcal toxins purified from different isolates has been reported and may explain the different apparent molecular weights observed. (C) Human PBMCs were incubated for 24 hours with 1% (vol/vol) supernatants of an overnight culture from S aureus Wood strain 46. Exudates were collected and analyzed for their IL-1β, TNF-α, and IL-6 content by ELISA. Results show the mean ± SD of 3 separate experiments for each cytokine. Background secretion was either below detection level or less than 1% of the stimulated secretion. (D) Human PBMCs stimulated with supernatants from an overnight culture of S aureus (open area) and unstimulated cells (filled area) were fixed, permeabilized, and subsequently stained with fluorescent antibodies against IL-1β, IL-6, and TNF-α. The figure shows the monocyte and lymphocyte population gated on SSC and FSC characteristics.
Figure 2.
Figure 2.
B1R and B2R mRNA expression in IMR-90 cells. IMR-90 cells were treated with 10 μM BK, 10 μM desArg9BK, 500 pg/mL IL-1β, 1% (vol/vol) PBMC exudates (supernatants from monocytes that had been stimulated for 24 hours with 1% S aureus overnight culture supernatants), 1% PBMC exudates in the presence of 10 μM BK, 1% PBMC exudates in the presence of 10 μM desArg9BK, or media alone in the absence of serum. Incubation times were 2 hours (A,C) and 6 hours (B,D). B1R (A-B) and B2R (C-D) mRNA expression was measured using quantitative real-time PCR and normalized to GAPDH mRNA levels. B1R and B2R mRNA expression in response to treatment with IL-1β was set to 100%. The figure presents the mean ± SEM of 3 independent experiments each performed in triplicate.
Figure 3.
Figure 3.
Surface expression of B1Rs and B2Rs on IMR-90 cells. IMR-90 cells were incubated for 6 hours with either 10 μM BK, 10 μM desArg9BK, 500 pg/mL IL-1β, 1% (vol/vol) PBMC exudates (supernatants of monocytes that had been stimulated for 24 hours with 1% S aureus overnight culture supernatants), 1% PBMC exudates in the presence of 10 μM BK, 1% PBMC exudates in the presence of 10 μM desArg9BK, or media alone in the absence of serum. After a washing step, cells were assayed for specific [3H]Des-Arg10kallidin (B1R ligand) binding (A) and [3H]BK (B2R ligand) binding (B). Binding of [3H]Des-Arg10kallidin and [3H]BK to nonstimulated cells (control) was normalized to 100% within each experiment. Results represent the mean ± SEM of 3 independent experiments performed in triplicate. **P < .01 by analysis of variance followed by Tukey method for pairwise comparisons.
Figure 4.
Figure 4.
Immunolocalization of B1R and B2R in IMR-90 cells. Ultra-thin sections of unstimulated (A,C) or stimulated with 1% (vol/vol) exudates from monocytes treated with 1% (vol/vol) S aureus supernatant from an overnight culture (B,D). IMR-90 cells were incubated with antibodies against B1R (A-B) or B2R (C-D). Bound antibodies were visualized by secondary antibodies labeled with 10-nm gold particles and processed as described in “Materials and methods.” Examples of intracellular (arrows) and membrane-associated receptors (arrowheads) are indicated. The scale bar indicates 0.5 μm (magnification ×25 000).
Figure 5.
Figure 5.
Expression of kinin receptors in response to PBMC exudates and kinins and chromatographic analysis of the hydrolysis of BK on rabbit smooth muscle cells. Rabbit smooth muscle cells were treated for 6 hours with BK, desArg9BK, IL-1β, 1% (vol/vol) exudates from monocytes stimulated with 1% (vol/vol) supernatant from an overnight culture of S aureus, or culture medium alone (control) in the absence of serum (A). After a washing step, cells were assayed for specific [3H]desArg10kallidin (B1R ligand; open bars) and [3H]BK (B2R ligand; filled bars) binding as described in “Materials and methods.” Specific binding is expressed as percent of control, where 100% is the binding to nontreated cells. The results represent mean ± SEM of at least 3 independent experiments done in triplicate. *P < .05 and **P < .01 compared with control values as determined by Student t test. NS indicates not significantly different from control values. Isotopically pure [3H]BK was incubated with rabbit smooth muscle cells. Supernatants were recovered after 3 hours (B), 6 hours (C), and 24 hours (D) and analyzed by HPLC as described in “Materials and methods.” Results are expressed as percent of total, where total is the total amount of eluted radioactivity. The result is representative of 3 experiments.
Figure 6.
Figure 6.
Effect of BK and desArg9BK on [3H]thymidine uptake in rabbit smooth muscle cells. (A) Rabbit smooth muscle cells were treated with BK, desArg9BK, PDGF, or buffer alone (control) for 24 hours and then assayed for [3H]thymidine incorporation as described in “Materials and methods.” The results are presented as percent of basal, where 100% basal is the amount of radioactivity in control. (B) Cells were incubated with BK or desArg9BK in the absence and presence of desArg9[Leu8]BK (DLBK) (B1 receptor antagonist) or HOE140 (B2 receptor antagonist). [3H]Thymidine incorporation was measured after 24 hours. Results are expressed as percent of control, where 100% control is the incorporation in the presence of BK or desArg9BK. The results represent mean ± SEM of at least 3 independent experiments done in triplicate. *P < .05 and **P < .01 compared with the control value as determined by Student t test. (C) Rabbit smooth muscle cells were treated for 24 hours with BK (1 μM) in the presence or absence of carboxypeptidase inhibitors of the kininase I type (DL-2-mercaptomethyl-3-guanidinoethylthiopropionic acid [MGTPA], potato carboxypeptidase inhibitor [PCI], 2-guani-dinoethylmercaptosuccinic acid [GEMSA], ε-aminocaproic acid [EACA], or a mix of all inhibitors; black bars). All inhibitors were applied at a final concentration of 10 μM. Control samples in the absence of BK were run in parallel (white bars). The results are presented in percent of thymidine incorporation into the DNA of the rabbit smooth muscle cells, where the incorporation into nontreated cells was set to 100%. The graph represents the mean ± SEM of 2 independent experiments performed in triplicate.
Figure 7.
Figure 7.
Detection of TSST-1 and SEB in supernatants from clinical S aureus isolates and expression of B1Rs and B2Rs in a patient suffering from an S aureus soft-tissue infection. (A-B) Supernatants from the clinical isolates 9730, 1878, 2374, 1024, and 15159 (lane 2 to 6) were separated on SDS-PAGE, transferred onto nitrocellulose membranes, and immunostained with antibodies against TSST-1 (A) or SEB (B). The strain ATCC 700699, whose genome has been completely sequenced, was used as a control (lane 1). Note that the apparent molecular weights of toxins vary between the tested strains. Size variation is a common feature of bacterial proteins from different strains that is often caused by homologous recombination between repeated regions within the gene and has normally no influence on the activity of the protein. (C) Tissue biopsies from the epicenter of the infection site and from a distal site were obtained from a patient with a soft-tissue infection caused by S aureus. The biopsies were cryosectioned and immunohistochemically stained for IL-1β, B1R, and B2R. Omission of the primary antibody was included as a negative control and was always completely negative. Stainings were quantified by in situ imaging and the results are presented as the imaging value: area and intensity of the positive stain (brown) in relation to the total cell area (blue), as previously described.
Figure 8.
Figure 8.
Proposed mechanism used by S aureus to interact with B1R and B2R. Based on the results of the present study, the following model is suggested. At the infectious site, invading monocytes become activated by staphylococcal toxins and secrete proinflammatory cytokines that induce an up-regulation of the B1R at the infectious focus. Plasma exudation into the infectious site will trigger contact activation and the formation of BK. BK can bind to B2R and trigger its down-regulation or be converted to the B1R agonist, desArg9BK, which subsequently leads to an activation and an additional up-regulation of B1R.

Similar articles

Cited by

References

    1. Lowy FD. Staphylococcus aureus infections. N Engl J Med. 1998;339: 520-532. - PubMed
    1. Yarwood JM, Schlievert PM. Quorum sensing in Staphylococcus infections. J Clin Invest. 2003;112: 1620-1625. - PMC - PubMed
    1. Balaban N, Rasooly A. Staphylococcal enterotoxins. Int J Food Microbiol. 2000;61: 1-10. - PubMed
    1. Kotb M. Superantigens of gram-positive bacteria: structure-function analyses and their implications for biological activity. Curr Opin Microbiol. 1998;1: 56-65. - PubMed
    1. McCormick JK, Yarwood JM, Schlievert PM. Toxic shock syndrome and bacterial superantigens: an update. Annu Rev Microbiol. 2001;55: 77-104. - PubMed

Publication types

MeSH terms