. 2006 Sep 15;108(6):2081-6.
doi: 10.1182/blood-2006-04-015859. Epub 2006 May 30.

Fetal hemoglobin silencing in humans

Affiliations

Fetal hemoglobin silencing in humans

Patricia A Oneal et al. Blood. .

Abstract

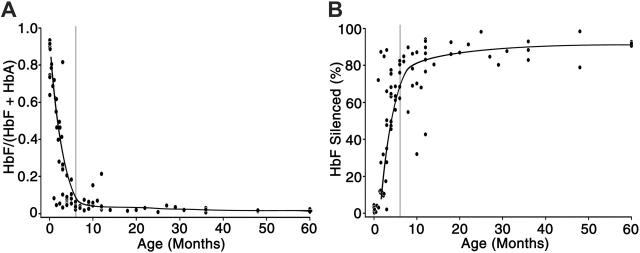
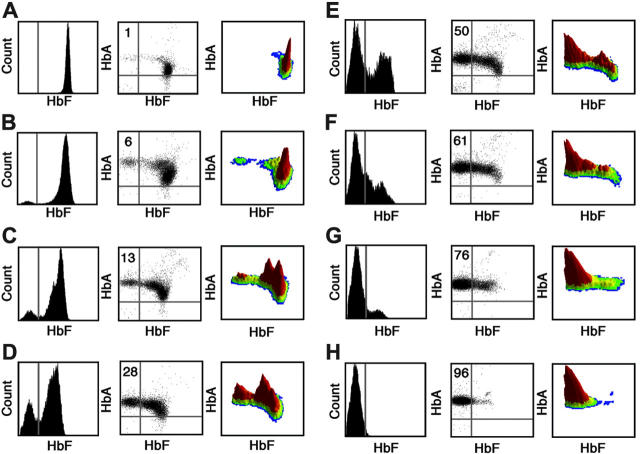
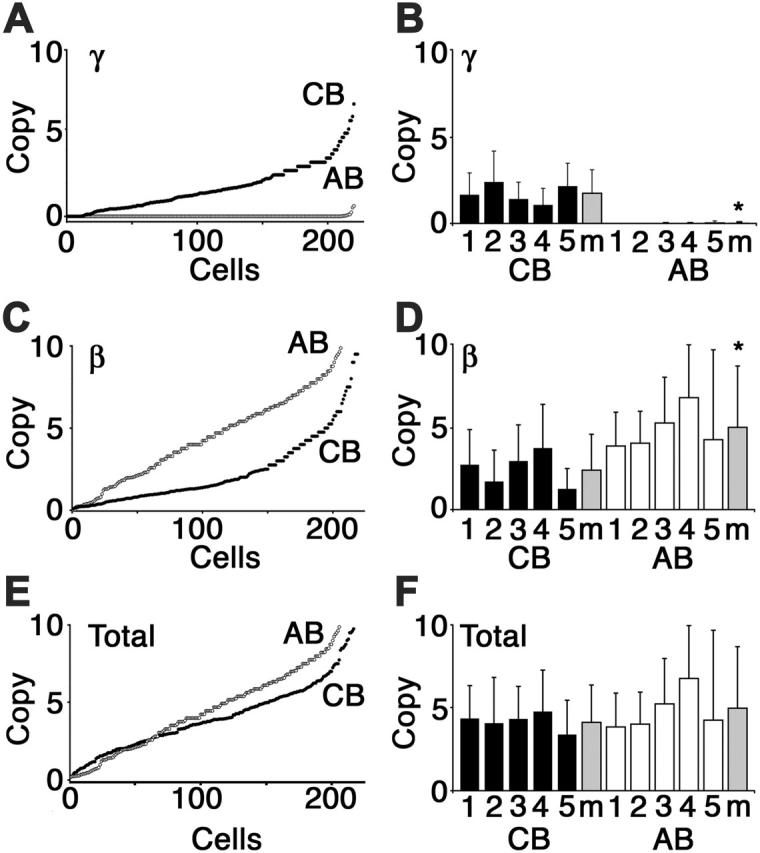
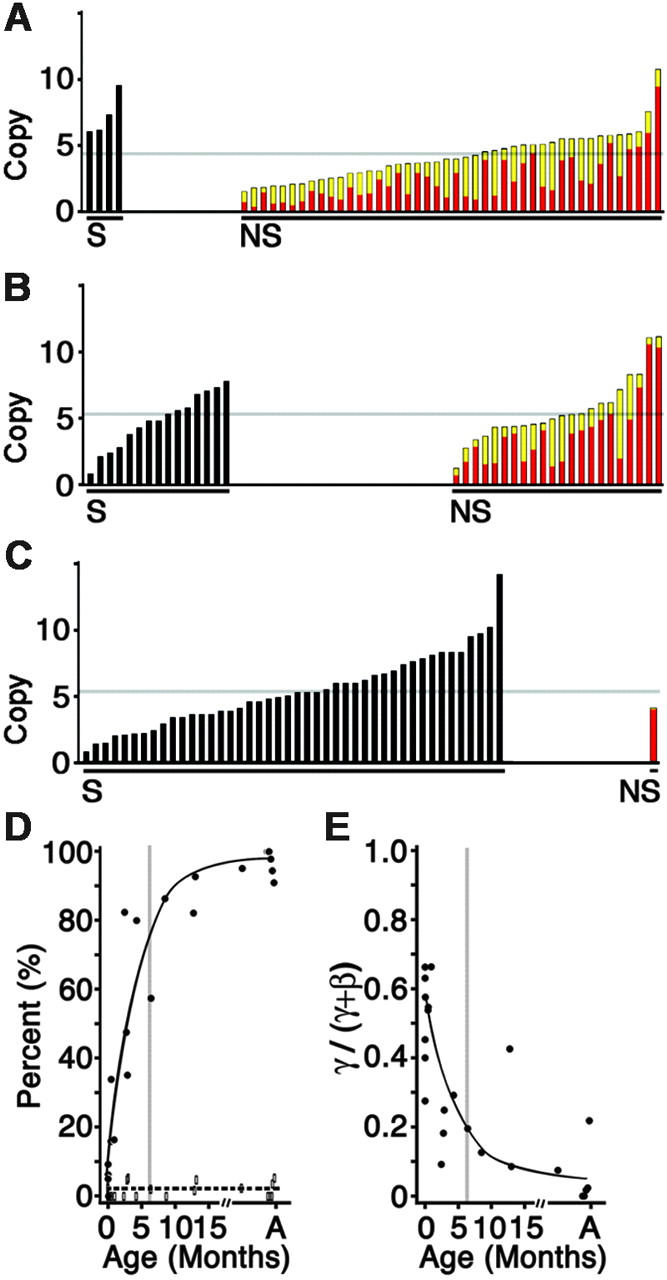
Interruption of the normal fetal-to-adult transition of hemoglobin expression should largely ameliorate sickle cell and beta-thalassemia syndromes. Achievement of this clinical goal requires a robust understanding of gamma-globin gene and protein silencing during human development. For this purpose, age-related changes in globin phenotypes of circulating human erythroid cells were examined from 5 umbilical cords, 99 infants, and 5 adult donors. Unexpectedly, an average of 95% of the cord blood erythrocytes and reticulocytes expressed HbA and the adult beta-globin gene, as well as HbF and the gamma-globin genes. The distribution of hemoglobin and globin gene expression then changed abruptly due to the expansion of cells lacking HbF or gamma-globin mRNA (silenced cells). In adult reticulocytes, less than 5% expressed gamma-globin mRNA. These data are consistent with a "switching" model in humans that initially results largely from gamma- and beta-globin gene coexpression and competition during fetal development. In contrast, early postnatal life is marked by the rapid accumulation of cells that possess undetectable gamma-globin mRNA and HbF. The silencing phenomenon is mediated by a mechanism of cellular replacement. This novel silencing pattern may be important for the development of HbF-enhancing therapies.


Figures

Figure 1.
Figure 1.
HbF expression and silencing in human erythrocytes. (A) HPLC analyses were performed on peripheral blood of 86 infant donors and plotted as HbF/(HbA + HbF) (expressed as a ratio; y-axis) versus postnatal age (months; x-axis). (B) The distribution of HbF-silenced cells (expressed as a percentage; y-axis) versus postnatal age (months; x-axis) as determined by flow cytometry. The smooth trend lines were drawn using averages for each 10-week interval. The postnatal (PN) age of the donors is shown on the x-axis with vertical gray lines at 6 months. Postnatal ages range from 1 day to 60 months.
Figure 2.
Figure 2.
Flow cytometric analyses of HbF and HbA expression during postnatal development. Representative flow cytometric histograms from (A) umbilical cord blood, (B-G) blood from infants of ages 1 to 6 months, respectively, and (H) adult blood. Cells were dual stained with anti-HbF and anti-HbA antibodies. Thirty thousand cells were analyzed for each sample. Left panels show histogram analyses of HbF expression (x-axis) versus the cell count (y-axis). Center panels show scatterplot analyses with HbF fluorescence (x-axis) versus HbA fluorescence (y-axis). The percentage of HbF-silenced cells is shown in the top left of each center panel. Right panels provide a 3-dimensional, density view of the data shown in the middle panels. The vertical axis represents the cell count at each level of HbF and HbA fluorescence. The HbF and HbA coordinates with cells are shown as peaks with arbitrarily assigned colors (red-colored peaks denote the highest densities of cells). Bars shown in left and center panels denote the upper level of fluorescence among 98% of cells stained with the isotypic controls.
Figure 3.
Figure 3.
Reticulocyte isolation by flow cytometry. Peripheral blood red cells were dual stained with anti–transferrin receptor (CD71) and a RNA-intercalating dye, thiazole orange (TO). (A) The CD71 fluorescence pattern of the erythrocyte population in peripheral blood. The forward scatter (size) is shown on the x-axis, and the box shows the CD71+ cells. (B) The TO fluorescence of the CD71+ cells in panel A; 97.5% of the CD71+ cells were also positive for TO.
Figure 4.
Figure 4.
Levels of gamma- and beta-globin mRNA in umbilical cord and adult blood reticulocytes. The copy number (× 1000) of cDNA for gamma-globin (A-B), beta-globin (C-D), and total (E,F; gamma + beta) in 440 individual reticulocytes collected from umbilical cord (CB) and adult (AB) are shown on each y-axis (Copy no.). Panels on the left (A,C,E) display data from 220 individual cells (x-axis) arranged from lowest to highest copy number. Panels on the right (B,D,F) show the mean copy number with standard deviations from each of the 5 cord blood donors (x-axis). Black bars indicates cord blood; open bars, adult blood; and gray bars, mean of 220 individual cells. AB indicates adult blood; CB, cord blood; and m, mean. Asterisks signify significance between cord and adult mean values (P < .005, paired Student t test).
Figure 5.
Figure 5.
Distribution of gamma- and beta-globin mRNA during postnatal development. The copy number (× 1000) of cDNA for individual reticulocytes sorted from (A) an umbilical cord, (B) a 2-month old infant, and (C) an adult human. Black bars represent gamma-globin gene–silenced (S) reticulocytes. Colored bars represent the nonsilenced (NS) reticulocytes with beta-globin copy number represented in red and gamma-globin copy number in yellow. The light gray line reflects a mean copy number for each donor. (D) Percentage of gamma-globin gene–silenced reticulocytes (•, solid line; gamma-globin mRNA below detection limit of 20 copies per cell) versus those reticulocytes containing low levels of gamma-globin mRNA (open boxes, dashed line; 21-100 copies of gamma-globin mRNA per cell) arranged according to donor age (x-axis). (E) Gamma-globin level among the nonsilenced populations expressed as a percentage of the total (gamma + beta; y-axis) arranged according to donor age (month; x-axis). The smooth trend lines were drawn using averages for each 10-week interval. In panels D and E, the postnatal (PN) age of the donors is shown on the x-axis with vertical gray lines at 6 months. A indicates adult.

References

    1. Bard H, Fouron JC, Gagnon C, Gagnon J. Hypoxemia and increased fetal hemoglobin synthesis. J Pediatr. 1994;124: 941-943. - PubMed
    1. Perrine SP, Greene MF, Faller DV. Delay in the fetal globin switch in infants of diabetic mothers. N Engl J Med. 1985;312: 334-338. - PubMed
    1. Di Benedetto A, Romano G, Campo S, Di Cesare E, Cucinotta D. No evidence of increased fetal haemoglobin in an adult diabetic population. Diabetes Res Clin Pract. 1996;33: 37-41. - PubMed
    1. Watson J, Stahman A, Bilello F. The significance of the paucity of sickle cells in newborn negro infants. Am J Med Sci. 1948;215: 419-423. - PubMed
    1. Jacob GF, Raper AB. Hereditary persistence of foetal haemoglobin production, and its interaction with the sickle-cell trait. Br J Haematol. 1958;4: 138-149. - PubMed

Publication types