Comparative Study
. 2006 Jun;127(6):737-48.
doi: 10.1085/jgp.200609497.

Calmodulin contributes to gating control in olfactory calcium-activated chloride channels

Affiliations
Comparative Study

Calmodulin contributes to gating control in olfactory calcium-activated chloride channels

Hiroshi Kaneko et al. J Gen Physiol. 2006 Jun.

Abstract

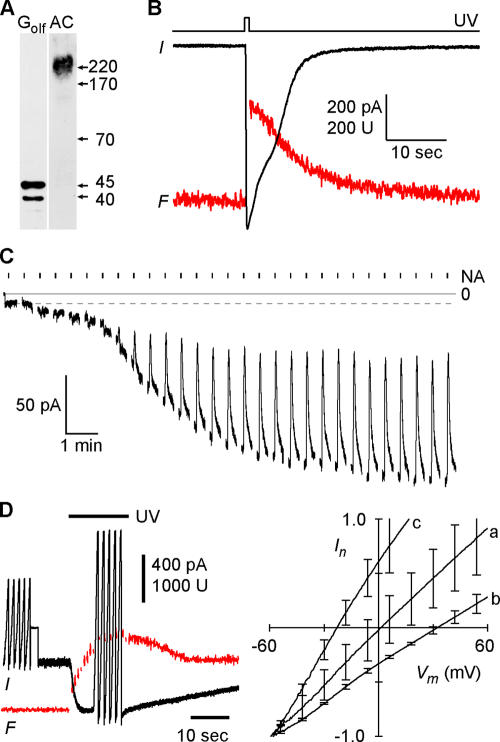
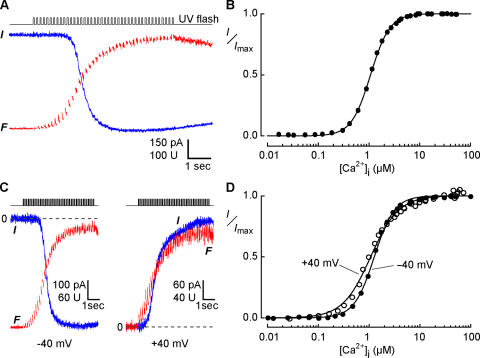
In sensory neurons of the peripheral nervous system, receptor potentials can be amplified by depolarizing Cl currents. In mammalian olfactory sensory neurons (OSNs), this anion-based signal amplification results from the sequential activation of two distinct types of transduction channels: cAMP-gated Ca channels and Ca-activated Cl channels. The Cl current increases the initial receptor current about 10-fold and leads to the excitation of the neuron. Here we examine the activation mechanism of the Ca-dependent Cl channel. We focus on calmodulin, which is known to mediate Ca effects on various ion channels. We show that the cell line Odora, which is derived from OSN precursor cells in the rat olfactory epithelium, expresses Ca-activated Cl channels. Single-channel conductance, ion selectivity, voltage dependence, sensitivity to niflumic acid, and Ca sensitivity match between Odora channels and OSN channels. Transfection of Odora cells with CaM mutants reduces the Ca sensitivity of the Cl channels. This result points to the participation of calmodulin in the gating process of Ca-ativated Cl channels, and helps to understand how signal amplification works in the olfactory sensory cilia. Calmodulin was previously shown to mediate feedback inhibition of cAMP-synthesis and of the cAMP-gated Ca channels in OSNs. Our results suggest that calmodulin may also be instrumental in the generation of the excitatory Cl current. It appears to play a pivotal role in the peripheral signal processing of olfactory sensory information. Moreover, recent results from other peripheral neurons, as well as from smooth muscle cells, indicate that the calmodulin-controlled, anion-based signal amplification operates in various cell types where it converts Ca signals into membrane depolarization.


Figures

Figure 1.
Figure 1.
Ca-activated Cl currents in Odora cells. (A) Western blot of Odora cell membrane proteins showing expression of adenylyl cyclase type III (AC) and the olfactory GTP binding protein Golf. (B) Simultaneous recording of whole-cell current (black trace) and Ca-dependent fluorescence (red trace) during flash-induced photorelease of Ca. The flash duration was 500 ms, Vm was −40 mV. (C) Sensitivity of the Ca-induced current to niflumic acid (NA). Whole-cell recording of an Odora cell during dialysis of the cytosol with a solution containing 3.5 μM free Ca and 140 mM CsCl. Immediately after breakthrough, the holding voltage was switched to −40 mV. The resulting leak current was about −9 pA (dashed line). As Ca diffused into the cell, the Cl current developed over 10 min up to a maximal amplitude of −160 pA. A 2-s pulse of 20 μM NA was delivered every 40 s. NA did not affect the leak current (first five pulses), but blocked 70% of the Ca-induced current. (D) To obtain I-Vm relations for the Ca-dependent channels, whole-cell currents were recorded during five voltage ramps (−60 to +60 mV) before and after photolysis of caged Ca. The averaged I-Vm relations recorded before illumination were subtracted from the I-Vm relations recorded during the maximal Ca signal. The resulting curves were normalized to their current values at −60 mV and superposed for symmetrical Cl concentrations (a, 140 mM Cl outside), for an outward-directed Cl gradient (b, 50 mM Cl outside), and for biionic conditions (c, 140 mM iodide outside). The pipette solution contained 145 mM Cl. This experiment demonstrates that the Ca-induced current is a Cl current and that the relative iodide permeability PI/PCl of the Ca-activated Cl channels is 3.
Figure 2.
Figure 2.
Single channel current and rundown of channel activity in excised patches. (A) Determination of the single-channel current of Ca-activated Cl channels. Ca-dependent Cl current was induced by a 1-s light flash to obtain a high level of intracellular Ca, and recorded at −40 mV during the return of the Ca concentration to submicromolar levels. The variance of the declining current was analyzed after high-pass filtering (2 Hz, gray trace). Current variance was determined after subtraction of the background variance measured upon return to the baseline. Variance analysis (inset) yielded a mean single channel current of 0.15 pA and a channel number of 5323 in this cell. (B) Current recording (mean ± SD of three patches; −40 mV) illustrating the decline of Ca-activated Cl currents in excised inside-out patches. Each point represents the current induced by a 5-s pulse of 67 μM Ca delivered to the cytosolic side of the patch. Blockage by 100 μM niflumic acid confirmed that the currents were conducted by Ca-activated Cl channels (not depicted). The initial current amplitudes were 1–2 pA, corresponding to 10–20 active channels. The current decline is described by a single-exponential function with a time constant of 5.0 min (solid line). (C) Continuous responsiveness of Ca-activated Cl channels in the whole-cell configuration. Intense light flashes (1 s duration) were applied 10 min after breakthrough and then at 10-min intervals (▾). Cl channels responded with phasic activation to each flash, and with tonic activation to the increasing level of free intracellular Ca (gray trace). A repeated flash after 30 s (▾*) was almost ineffective because the pool of caged Ca was exhausted by the preceding 1-s flash and had to be replenished by diffusion from the pipette. The fluorescence recording is interrupted during flash delivery, masking the peaks of the Ca transients during illumination.
Figure 3.
Figure 3.
Calibration of Ca-dependent fluorescence in the presence of caged Ca. (A) Increasing fluorescence during progressive photolysis of DM-nitrophen at λ = 340 nm (both for excitation and photolysis). Spectra were obtained from 50 μM DM-nitrophen dissolved in pipette solution. (B) Fluorescence quenching of Ca-saturated fluo-5F by increasing concentrations of caged (DM-N, left) or photoreleased (DM-N*, center) DM-nitrophen (0, 1, 3, 10, 30, 100, 300, 1,000, 3,000, 5,000 μM). The diagram illustrates the higher quenching efficacy of DM-N* at concentrations >100 μM. λexc = 475 nm. (C) Decline of the fluorescence of Ca-saturated fluo-5F during a series of 50-ms flashes due to the increasing ratio of DM-N*/DM-N. The same flash protocol was used for the determination of Ca sensitivity in this study. Fluorescence quenching causes a ∼15% reduction of the signal in cells (black traces) and in cell-free pipette solution (red trace). (D) Calibration of fluo-5F fluorescence. The fluorescence of 20 μM fluo-5F was measured in a series of Ca-standard solutions (•), which was also used to calibrate a Ca electrode. The fluorescence was then measured in two sets of solutions containing either 5 mM DM-N (♦) or 5 mM DM-N* (◯), as well as different concentrations of total Ca2+, resulting in the indicated free Ca concentrations ([Ca2+]), which were determined using the Ca electrode. The apparent KD of fluo-5F (0.80–0.84 μM) was not significantly changed by DM-N or DM-N*.
Figure 4.
Figure 4.
Determination of the Ca sensitivity of Cl channels in an Odora cell. (A) Simultaneous current (blue trace) and fluorescence (red trace) recordings at −40 mV during incremental photolysis of caged Ca in an Odora cell. A series of 42 flashes (50 ms) with reduced light intensity caused a stepwise increase of the cytosolic Ca concentration that saturated both the Cl channels and the Ca-sensitive dye. (B) Dose–response relation for the activation of Cl channels obtained from the data in A. The Ca concentration for half-maximal activation K1/2 was 1.07 μM, with a Hill coefficient of 2.3. (C) Examination of the effect of membrane voltage on Ca sensitivity. The same protocol as in A was applied at −40 mV (left) and at + 40 mV (right). The inward current at −40 mV was generated by Cl efflux, the outward current at +40 mV by Cl influx. The dashed line indicates zero current. (D) Dose–response relation obtained from the data in C, yielding K1/2 and n values of 1.27 μM and 2.19 for −40 mV, and 1.07 μM and 1.58 for +40 mV, respectively.
Figure 5.
Figure 5.
Effects of mutant calmodulins on the Ca sensitivity of Cl channels. (A) Current and fluorescence recordings from two cells that displayed similar increments of intracellular Ca in response to a flash series. The red traces were recorded from a cell transfected with the mutant CaM R2, in which one of the two NH2-terminal Ca binding sites is disabled by a point mutation. Note that more flashes (i.e., higher Ca concentrations) are necessary to achieve half-maximal activation in the cell expressing the mutant. Normalized recordings obtained at −40 mV. (B) Dose–response relations derived from the data in A. Transfection with CaM R2 shifted the dose–response curve to the right, increasing K1/2 from 1.07 to 2.09 at constant Hill coefficient (n = 2.3). (C) Collected results of transfection experiments with mutant calmodulins. The disabled Ca binding sites are indicated by dark gray dots on the CaM symbols. Asterisks indicate the significance level (nonpaired Student's t test) compared with control cells. “Exp.” denotes the number of cells examined (two to seven transfections each). Mutations in the Ca binding sites 1, 2, and 4 caused a reduction of Ca sensitivity, while a mutation in binding site 3 was ineffective. The totally inactive mutant CaM R1234 points to a requirement of Ca for the association of CaM with the Cl channel (see Discussion). Ranges for K1/2 values were (in μM) as follows. Control, 0.91–1.98; CaM WT, 0.90–2.07; CaM R1, 1.33–2.17; CaM R2, 1.06–2.40; CaM R3, 0.83–1.74; CaM R4, 1.16–2.13; CaM R12, 1.06–2.49; CaM R34, 1.19–1.90; CaM R1234, 0.63–2.05.
Figure 6.
Figure 6.
Model for anion-based signal amplification in OSN cilia. Odorants bind to receptor proteins in the ciliary membrane (R). This leads to the synthesis of cAMP through activation of adenylyl cyclase type III (AC) and to opening of Ca-permeable, cAMP-gated transduction channels, which conduct a small primary receptor current. The inflowing Ca induces an excitatory Cl current by opening Ca-CaM–activated Cl channels. This amplifies the primary receptor current about 10-fold because Cl channels outnumber cAMP-gated channels by a factor of eight. Ca also triggers inhibitory processes (dashed lines), including the feedback inhibition of the cAMP-gated channels, the activation of PDE by Ca-CaM, and the inhibition of AC III through phosphorylation by the CaM-dependent protein kinase CaMK II. CaM thus controls the molecular events that generate and terminate the olfactory receptor current.

Similar articles

Cited by

References

    1. Ault, B., and L.M. Hildebrand. 1994. GABAA receptor-mediated excitation of nociceptive afferents in the rat isolated spinal cord-tail preparation. Neuropharmacology. 33:109–114. - PubMed
    1. Alseikhan, B.A., C.D. DeMaria, H.M. Colecraft, and D.T. Yue. 2002. Engineered calmodulins reveal the unexpected eminence of Ca2+ channel inactivation in controlling heart excitation. Proc. Natl. Acad. Sci. USA. 99:17185–17190. - PMC - PubMed
    1. Alvarez-Leefmans, F.J., M. Leon-Olea, J. Mendoza-Sotelo, F.J. Alvarez, B. Anton, and R. Garduno. 2001. Immunolocalization of the Na+-K+-2Cl− cotransporter in peripheral nervous tissue of vertebrates. Neuroscience. 104:569–582. - PubMed
    1. Bhandawat, V., J. Reisert, and K.-W. Yau. 2005. Elementary response of olfactory receptor neurons to odorants. Science. 308:1931–1934. - PMC - PubMed
    1. Boekhoff, I., E. Tareilus, J. Strotmann, and H. Breer. 1990. Rapid activation of alternative second messenger pathways in olfactory cilia from rats by different odorants. EMBO J. 9:2453–2458. - PMC - PubMed

Publication types