. 2006 May 31;1(1):9.
doi: 10.1186/1748-7188-1-9.

On the maximal cliques in c-max-tolerance graphs and their application in clustering molecular sequences

Affiliations

On the maximal cliques in c-max-tolerance graphs and their application in clustering molecular sequences

Katharina A Lehmann et al. Algorithms Mol Biol. .

Abstract

Given a set S of n locally aligned sequences, it is a needed prerequisite to partition it into groups of very similar sequences to facilitate subsequent computations, such as the generation of a phylogenetic tree. This article introduces a new method of clustering which partitions S into subsets such that the overlap of each pair of sequences within a subset is at least a given percentage c of the lengths of the two sequences. We show that this problem can be reduced to finding all maximal cliques in a special kind of max-tolerance graph which we call a c-max-tolerance graph. Previously we have shown that finding all maximal cliques in general max-tolerance graphs can be done efficiently in O(n3 + out). Here, using a new kind of sweep-line algorithm, we show that the restriction to c-max-tolerance graphs yields a better runtime of O(n2 log n + out). Furthermore, we present another algorithm which is much easier to implement, and though theoretically slower than the first one, is still running in polynomial time. We then experimentally analyze the number and structure of all maximal cliques in a c-max-tolerance graph, depending on the chosen c-value. We apply our simple algorithm to artificial and biological data and we show that this implementation is much faster than the well-known application Cliquer. By introducing a new heuristic that uses the set of all maximal cliques to partition S, we finally show that the computed partition gives a reasonable clustering for biological data sets.


Figures

Figure 1
Figure 1
The left side shows a set of 11 sequences that are aligned to a common reference sequence, but do not have any special ordering that makes it easy to distinguish clusters of similar sequences. On the right a reasonable ordering is given where colors indicate groups of sequences that have a 60% overlap for each pair of sequences. Note that the given coloring might not be the only reasonable.
Figure 2
Figure 2
The semi-squares can be ordered according to the height of their hypotenuse at a given x-position.
Figure 3
Figure 3
A set of intervals A-E together with its corresponding semi-square representation. This example for c = 0.5 also shows that not all candidate cliques are maximal with respect to the set of active semi-squares: When D is born, there are two maximal cliques in the y-structure: {A, B} and {B, C}. D is intersecting with A and B. Thus, there will be one candidate clique {A, B, D}, built from clique {A, B}, and {A, D}, built from {B, C}. The latter candidate clique is thus not maximal with respect to all active cliques and should not be inserted into Q.
Figure 4
Figure 4
Algorithm for computing all maximal cliques.
Figure 5
Figure 5
Clique {2, 3,4} at x = 2 has a global ordering of B(2), B(3), B(4), H(2), H(3), H(4) and a global ordering of B(2), B(3), H(2), H(3), B(4), H(4) at x = 4. When an interval is added to the y-structure it can either intersect all of the bases of a clique, or only a part of the bases, and/or all of the hypotenuses, or just a part of them. If it intersects all bases and/or hypotenuses, it can simply be added to that clique, if it only intersects a part of the bases and/or hypotenuses, it will split the clique.
Figure 6
Figure 6
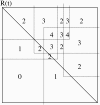
Computing the maximal cliques regarding the hypotenuse t by intersection r (t) with Pr(t),Qr(t) and Rr(t). In the example, we have two rectangles from Pr(t), two from Rr(t) and one from Q(t). The numbers denote the cover-values of the corresponding polygons.
Figure 7
Figure 7
The grey area denotes the basic intersection staircase, which describes the maximal cliques which potentially must not be considered since they have been considered already during the computation of the maximal cliques for hypotenuses like t' lower than t. In the example, we have three diagonals t' lower than t whose rectangles r (t') intersect t.
Figure 8
Figure 8
The basic intersection staircase shown in grey must be refined since there are rectangles like Pi Pr(t) and r Rr(t) which have not been considered before in the runs for t' and which reduce the basic intersection staircase such that a lower staircase shown in darkgrey remains. Hence for the computation of the maximal cliques regarding t we have to reduce the area of the upper half only by the refined staircase.
Figure 9
Figure 9
a) The runtimes shown in this figure are based on artificial data sets. Here, the maximal length is 100 and from all possible intervals a random set is chosen, ranging from 10% to 50% of all possible intervals. The time needed to compute all maximal cliques for all constraints from 0.05 to 0.95 is given in ms. b) gives the number of maximal cliques found in the data sets.
Figure 10
Figure 10
All maximal cliques in three different biological data sets were computed. The time needed by our algorithm is given in ms in dependence of the chosen constraint value c.
Figure 11
Figure 11
a) The number of maximal cliques found and b) the average number of maximal cliques a sequence is contained in are highly sensitive on the chosen c-value as can be seen for three biological data sets.
Figure 12
Figure 12
With a constraint of 0.6 intervals 1, 2, 3 build a clique. The common overlap of all 3 intervals is [4-10], which is only 3/7 of interval 3.
Figure 13
Figure 13
a) There are three distinguishable clusters: {1, 2, 3}, {4, 5, 6}, {7, 8, 9} but as long as c is below 4/11 there is only one maximal clique embracing all intervals. Not until c is larger than 3/5, the wanted three sets will emerge as maximal cliques. b) Here, the situation is different. Intuitively, only one set embracing all intervals should emerge. But this homogenous set will be split into two maximal cliques when c is greater than 3/5: one contains interval 5 and one interval 6.
Figure 14
Figure 14
The partitions found by the heuristic described in the text, for a constraint value of c = 0.65. a) Shankl, b) Celsr2, c) PpmaT. Members of the same clique are colored equally.

References

    1. Altschul S, Gish W, Miller W, Myers E, Lipman D. Basic Local Alignment Search Tool. J Mol Biol. 1990;215:403–410. doi: 10.1006/jmbi.1990.9999. - DOI - PubMed
    1. NCBI-Blast http://www.ncbi.nlm.nih.gov/BLAST/
    1. Golumbic MC, Trenk AN. Tolerance Graphs. Cambridge University Press; 2004.
    1. Benzer S. On the Topology of the Genetic Fine Structure. PNAS. 1959;45:1607–1620. doi: 10.1073/pnas.45.11.1607. - DOI - PMC - PubMed
    1. Fulkerson D, Gross O. Incidence matrices and interval graphs. Pacific J Math. 1965;15:835–855.

LinkOut - more resources