. 2006 Aug;17(8):3435-45.
doi: 10.1091/mbc.e06-01-0008. Epub 2006 May 31.

Lymphocyte chemotaxis is regulated by histone deacetylase 6, independently of its deacetylase activity

Affiliations

Lymphocyte chemotaxis is regulated by histone deacetylase 6, independently of its deacetylase activity

J Román Cabrero et al. Mol Biol Cell. 2006 Aug.

Abstract

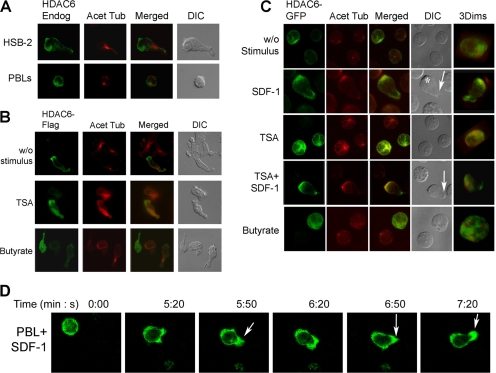
In this work, the role of HDAC6, a type II histone deacetylase with tubulin deacetylase activity, in lymphocyte polarity, motility, and transmigration was explored. HDAC6 was localized at dynamic subcellular structures as leading lamellipodia and the uropod in migrating T-cells. However, HDAC6 activity did not appear to be involved in the polarity of migrating lymphocytes. Overexpression of HDAC6 in freshly isolated lymphocytes and T-cell lines increased the lymphocyte migration mediated by chemokines and their transendothelial migration under shear flow. Accordingly, the knockdown of HDAC6 expression in T-cells diminished their chemotactic capability. Additional experiments with HDAC6 inhibitors (trichostatin, tubacin), other structural related molecules (niltubacin, MAZ-1391), and HDAC6 dead mutants showed that the deacetylase activity of HDAC6 was not involved in the modulatory effect of this molecule on cell migration. Our results indicate that HDAC6 has an important role in the chemotaxis of T-lymphocytes, which is independent of its tubulin deacetylase activity.


Figures

Figure 1.
Figure 1.
Tubulin acetylation increases during T-lymphocyte activation. (A) PBLs were incubated with PHA (1 μg/ml) for 48 h, washed, and cultured in the presence of 50 U/ml IL-2. At indicated times, cells were sonicated and cell lysates were subjected to SDS-PAGE and immunoblot for detecting total and acetylated tubulin, as stated in Materials and Methods. The progressive increase in acetylated tubulin during lymphocyte activation, and the values of the acetylated/total tubulin ratio are shown. (B) Double immunofluorescence staining for tubulin (green fluorescence) and acetylated tubulin (red fluorescence) in resting PBLs, T-lymphoblasts, and HSB-2 T-cells. The predominant localization of acetylated tubulin in bundles around MTOC is shown.
Figure 2.
Figure 2.
HDAC 6 and acetylated tubulin localization in motile T-lymphocytes. (A) Localization of endogenous HDAC6 and acetylated tubulin in HSB-2 cells and PBLs. Cells adhered to FN-coated coverslips were fixed, permeabilized, and double-stained for HDAC6 and acetylated tubulin. (B) HDAC6-Flag–transfected HSB-2 cells pretreated with the indicated drugs were adhered to FN-coated coverslips and stained with antibody against acetylated tubulin and HDAC6-Flag, as stated in Materials and Methods. (C) HDAC6-GFP–transfected PBLs incubated with the indicated stimuli and adhered to 50 μg/ml FN were fixed, permeabilized, and stained for acetylated tubulin. Arrows pointed to leading edge and the asterisk stands on the rear pole in the SDF-1α–polarized PBLs. (D) Time-lapse sequence of HDAC6-GFP–expressing PBLs transfected by nucleofection. Cells were allowed to adhere to FN and stimulated with 100 ng/ml SDF-1α at time zero. Then, cells were analyzed for 7 min by time-lapse confocal microscopy, as stated in Materials and Methods. Arrows pointed to the leading edge in the SDF-1α–polarized migrating PBLs.
Figure 3.
Figure 3.
Effect of HDAC6 inhibitor TSA on PBL chemotaxis and adhesion. PBLs were incubated with the indicated drugs (1 mM butyrate, 10 nM TXL, 5 μg/ml NCD, or 5 μM TSA) and the following assays performed: (A) Chemotaxis assays in Transwell chambers. PBLs were allowed to migrate toward 100 ng/ml SDF-1α. The percentage of migrated cells ± SD is shown. (B) Transmigration across TNF-α–activated endothelium in Transwell chambers. The percentage of migrated cells ± SD is shown. (C) Adhesion to fibronectin. The percentage of adhered cells ± SD is shown. (D) Adhesion to resting (white bars) or TNF-α activated (dark gray bars) endothelium. The percentage of adhered cells ± SD is shown. (E) Lymphocyte transendothelial migration under physiological shear flow conditions across TNF-α–activated HUVEC cells. The number of rolling (white bars), adhered (light tone gray bars), transmigrating (dark gray bars), and detached (black bars) cells ± SD is shown and was calculated as described in Material and Methods. (F) TSA treatment augments PBL detachment under shear stress. The percentage of detached cells was analyzed in seven different fields under increasing flow rates, ranging from 0.5 to 10 dyn/cm2 of wall shear stress, and is represented as the mean ± SD. (×), control PBLs without treatment; ■, 1 mM sodium butyrate; ♦, 5 μM TSA pretreatment, 1 h.
Figure 4.
Figure 4.
Effects of specific HDAC6 inhibitor tubacin and derivatives on lymphocyte chemotaxis. (A) Molecular structure of Tubacin and derivatives, where the Zn2+ chelating group is marked. TSA formula is also included. (B) Western-blot showing the tubulin acetylation levels in cells untreated or treated with 50 μM of the indicated chemical inhibitors is shown. (C) Cell migration assays in Transwell chambers. Dose-dependent inhibitory effects of HDAC6 targeting drugs on the chemotactic response of CEM T-cells to SDF-1α. (D) Adhesion to FN (20 μg/ml for T-cell lines and 50 μg/ml for PBLs) of lymphocytes untreated or treated with Tubacin and niltubacin. Four representative experiments are shown. Arbitrary units.
Figure 5.
Figure 5.
Niltubacin competes tubacin-mediated effect on HDAC6 tubulin deacetylase activity. (A) Effect on tubulin acetylation of increasing doses of tubacin or niltubacin. (B and C) Prevention of the tubacin inhibitory effect on HDAC6 tubulin deacetylase activity by niltubacin. Western blotting of a representative experiment (B) and competition curve of increasing doses of niltubacin versus 0.5 μM tubacin. Mean ± SD of four independent experiments is represented (C). (D) Inhibition of SDF-1α–directed migration by increasing doses of tubacin alone or 0.5 μM tubacin plus increasing doses of niltubacin. In each paired histograms, the same final amounts of tubacin alone (■) or Tubacin plus niltubacin (□) are represented.
Figure 6.
Figure 6.
TSA, tubacin, and niltubacin do not modify the polarization of PBL induced by SDF-1. PBL were treated as indicated and then allowed to adhere to FN-coated coverslips for 15 min. Cells were then fixed and stained with an anti-ICAM-3 mAb followed by an FITC-labeled secondary antibody. Cell polarization was determined as stated in Materials and Methods. The arithmetic mean ± SD of three independent experiments is shown.
Figure 7.
Figure 7.
Functional effects of HDAC6 overexpression in T-cell migration. (A) CEM cells (1.0 × 10⁷) transduced or not with GFP or HDAC6-GFP were lysed, sonicated, and immunoblotted with antibodies against the indicated molecules. (B) HDAC6-GFP overexpression enhanced the migratory behavior of CEM cells. Transduced CEM cells, overexpressing GFP alone, wtHDAC6-GFP or HDAC6 H216A/H611A-EGFP (HDAC6 DD) were allowed to transmigrate in Transwell chambers toward 100 ng/ml SDF-1. Fold induction ± SD of migrated cells of three different experiments is shown. Quantitative flow cytometric analyses of the expression levels by CEM cells transduced with GFP, HDAC6-GFP, and HDAC6DD-GFP. (C) Confocal videomicroscopy sequence showing the cellular distribution of GFP, or HDAC6-GFP in CEM cells. Image represents the fluorescence intensity of GFP in an arbitrary pseudocolor map (bar on top left). (D) HDAC6 enhances lymphocyte transendothelial migration under flow. Rolling, adhesion, transmigration, and detachment of HDAC6-overexpressing CEM cells under shear stress. Transendothelial migration of parental and transduced CEM cells (GFP alone or HDAC6-GFP) under shear stress across a TNF-α–activated HUVEC monolayer. The number of rolling (white bars), adhered (light gray tone bars), transmigrated (dark gray bars) and detached (black bars) cells were obtained as described in Materials and Methods. Data represent values ± SD from two independent experiments.
Figure 8.
Figure 8.
Regulation of the chemotactic and transmigration responses of lymphocytes by silencing of HDAC6. (A) HDAC6-GFP or HDAC6 H216A/H611A-GFP overexpression enhanced the migratory ability of PBLs versus GFP overexpression. Nucleofected PBLs overexpressing HDAC6-GFP, HDAC6 H216A/H611A (HDAC6 DD), or GFP were allowed to migrate toward a chemotactic gradient of 100 ng/ml SDF-1α in Transwell chambers. Two independent experiments with different healthy donors are shown. (B) Effect of HDAC6 knocking-down in PBL chemotaxis. Western blotting analysis of HDAC6 and acetylated tubulin in siRNA HDAC6-interfered PBLs. Two independent migration assays in Transwell chambers, with HDAC6 knocked-down PBLs versus mock nucleofected with control negative oligonucleotides from different healthy donors, are shown. (C) Rescue of defective migratory activity of HDAC6 knockdown cells. CEM cells were interfered with siRNA HDAC6, and 48 h later were transfected with either wild type or DD (double deacetylase dead mutant) and then assayed for chemotactic migration in Transwell chambers. (D) HDAC6 knockdown inhibits lymphocyte transendothelial migration under flow. Rolling, adhesion, transmigration, and detachment events were quantified for negative control siRNA (dark gray bars) and HDAC6 siRNA (white bars) treated cells under physiological shear stress on a TNF-α–activated HUVEC monolayer. The number of cells in each step was quantified as described in Material and Methods. Control Western blotting analysis of HDAC6 and alpha-tubulin in siRNA HDAC6-interfered CEM cells is shown. Data show mean values ± SD from four independent experiments.

Similar articles

Cited by

References

    1. Alon R., Feigelson S. From rolling to arrest on blood vessels: leukocyte tap dancing on endothelial integrin ligands and chemokines at sub-second contacts. Semin. Immunol. 2002;14:93–104. - PubMed
    1. Bali P., et al. Inhibition of histone deacetylase 6 acetylates and disrupts the chaperone function of heat shock protein 90, a novel basis for antileukemia activity of histone deacetylase inhibitors. J. Biol. Chem. 2005;280:26729–26734. - PubMed
    1. Barreiro O., Yanez-Mo M., Sala-Valdes M., Gutierrez-Lopez M. D., Ovalle S., Higginbottom A., Monk P. N., Cabanas C., Sanchez-Madrid F. Endothelial tetraspanin microdomains regulate leukocyte firm adhesion during extravasation. Blood. 2005;105:2852–2861. - PubMed
    1. Barreiro O., Yanez-Mo M., Serrador J. M., Montoya M. C., Vicente- Manzanares M., Tejedor R., Furthmayr H., Sanchez-Madrid F. Dynamic interaction of VCAM-1 and ICAM-1 with moesin and ezrin in a novel endothelial docking structure for adherent leukocytes. J. Cell Biol. 2002;157:1233–1245. - PMC - PubMed
    1. Bertos N. R., Gilquin B., Chan G. K., Yen T. J., Khochbin S., Yang X. J. Role of the tetradecapeptide repeat domain of human histone deacetylase 6 in cytoplasmic retention. J. Biol. Chem. 2004;279:48246–48254. - PubMed

Publication types

MeSH terms